Astaxanthin الأشكال
56 أشكال من أبحاث محكّمة
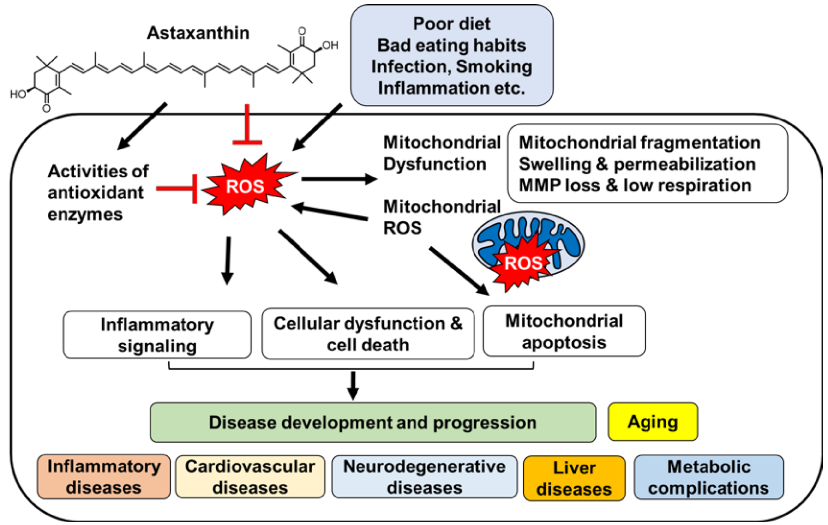
Proposed comprehensive mechanism by which astaxanthin inhibits oxidative stress-induced mitochondrial dysfunction, preventing downstream apoptotic and inflammatory signaling cascades.
Inhibitory Effect of Astaxanthin on Oxidative Stress-Induced Mitochondrial Dysfunction-A Mini-Review.
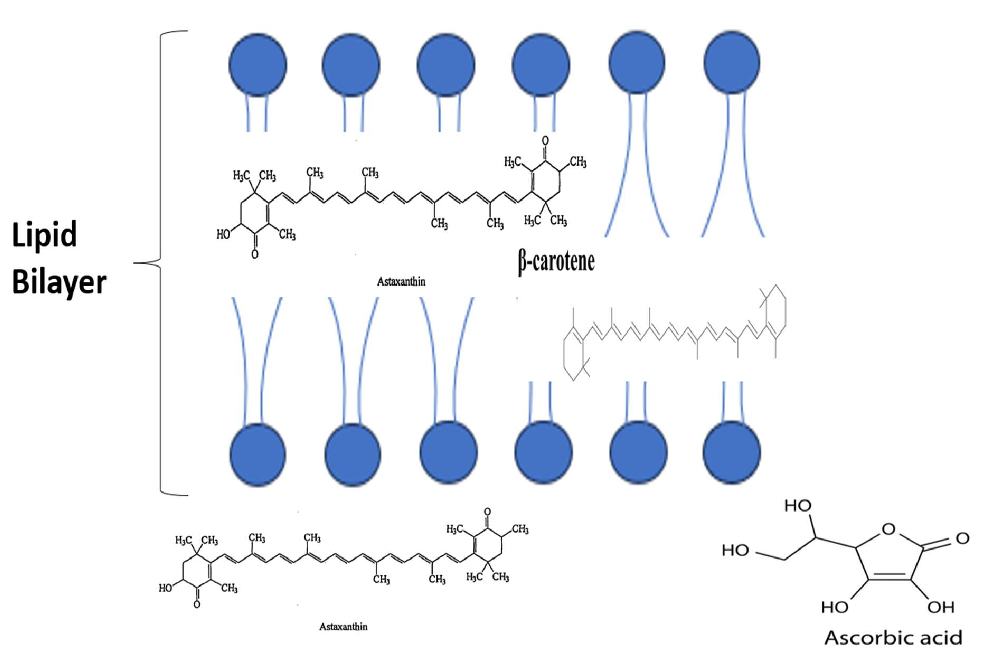
![Figure 1.Figure 1.Transmembrane orientation of astaxanthin [Transmembrane orientation of astaxanthin [1,9]. 1,9].](https://pdfs.citedhealth.com/figures/26861359/55.png)
Astaxanthin's transmembrane orientation is unique among carotenoids, spanning the entire lipid bilayer with its polar end groups anchored at both membrane surfaces. This positioning enables superior antioxidant protection of membrane lipids.
Potential Anti-Atherosclerotic Properties of Astaxanthin.
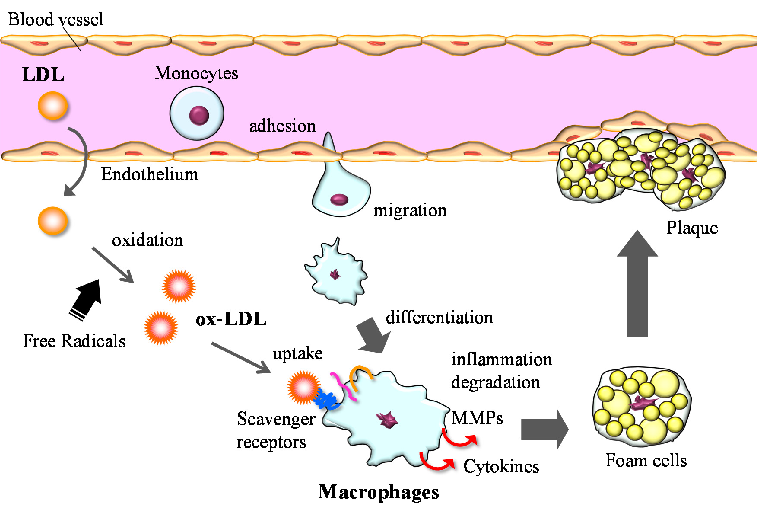
Macrophages play a central role in atherosclerosis development through uptake of oxidized LDL, foam cell formation, and secretion of inflammatory mediators. Astaxanthin may interrupt this process by reducing LDL oxidation and modulating macrophage activity.
Potential Anti-Atherosclerotic Properties of Astaxanthin.
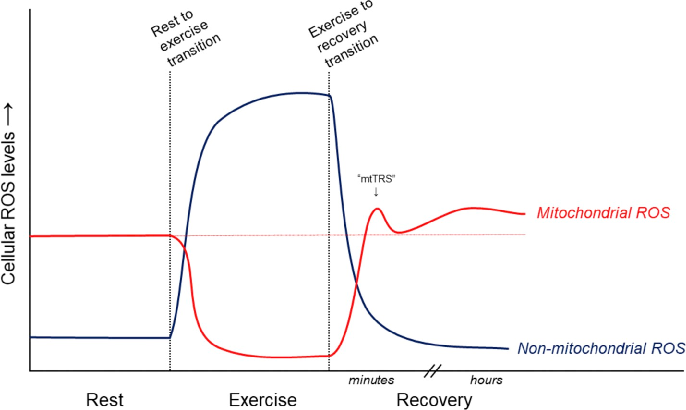
Proposed relative contributions of mitochondrial and non-mitochondrial ROS sources to overall cellular ROS levels in skeletal muscle during and after exercise are depicted. NADPH oxidase, xanthine oxidase, and mitochondrial electron transport chain are the primary generators.
Antioxidant supplements and endurance exercise: Current evidence and mechanistic insights.
![Figure 2. Chemical structure of the main xanthophylls present in algae [82].](https://pdfs.citedhealth.com/figures/33801636/327.png)
Marine algae produce several structurally distinct xanthophylls with unique bioactive profiles. This figure displays the chemical structures of the main xanthophylls present in algae, including fucoxanthin, astaxanthin, zeaxanthin, and lutein.
Xanthophylls from the Sea: Algae as Source of Bioactive Carotenoids.
Bioavailability and metabolism of dietary xanthophylls determine their physiological impact. This figure presents data on the absorption, distribution, and metabolic fate of algal carotenoids in biological systems.
Xanthophylls from the Sea: Algae as Source of Bioactive Carotenoids.
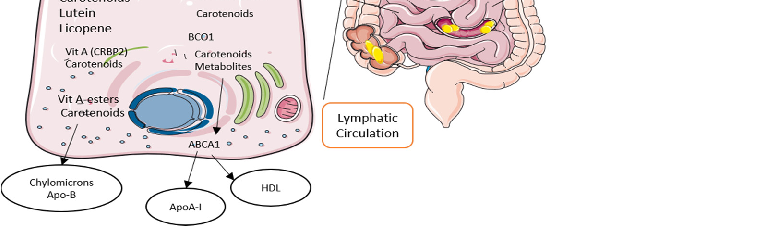
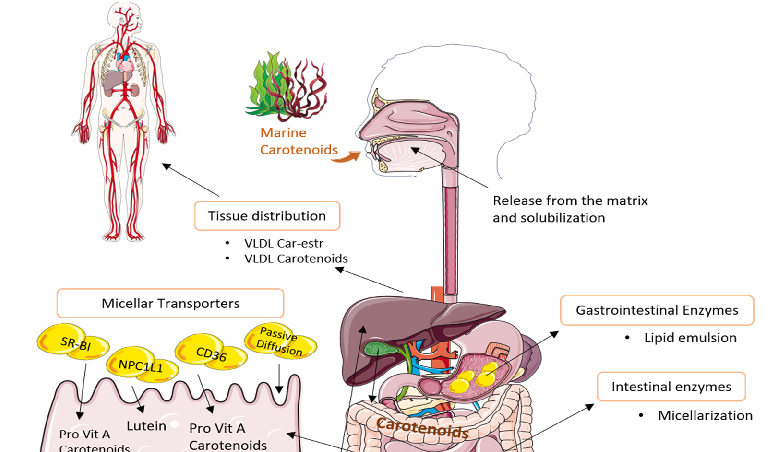
Marine carotenoids follow specific uptake, transport, and secretion pathways in the human body. This figure traces the journey of dietary xanthophylls from intestinal absorption through lymphatic transport to tissue distribution and hepatic metabolism.
Xanthophylls from the Sea: Algae as Source of Bioactive Carotenoids.
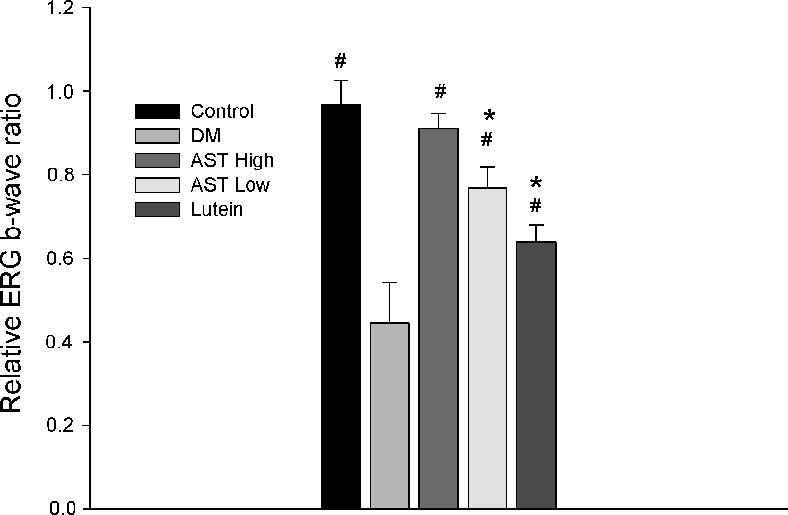
Electroretinography (ERG) recordings evaluating retinal function in control and STZ-induced diabetic rats treated with normal saline, 0.6 mg/kg AST, 3 mg/kg AST, or 0.5 mg/kg lutein for 8 weeks. ERG wave amplitudes indicate the functional impact of each treatment on diabetic retinal physiology.
Astaxanthin Inhibits Expression of Retinal Oxidative Stress and Inflammatory Mediators in Streptozotocin-Induced …
Inflammatory marker expression levels in retinal tissue or aqueous humor of diabetic rats, comparing astaxanthin-treated groups with untreated diabetic controls. Results indicate AST may modulate inflammatory mediator production.
Astaxanthin Inhibits Expression of Retinal Oxidative Stress and Inflammatory Mediators in Streptozotocin-Induced …
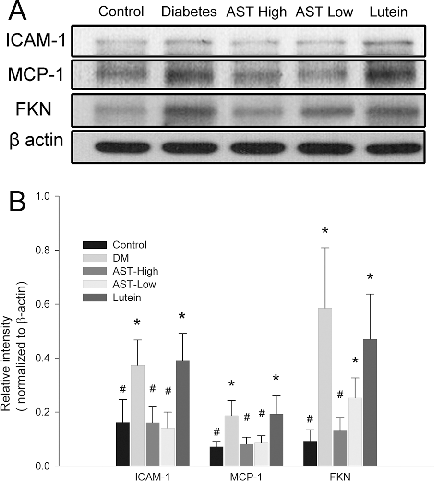
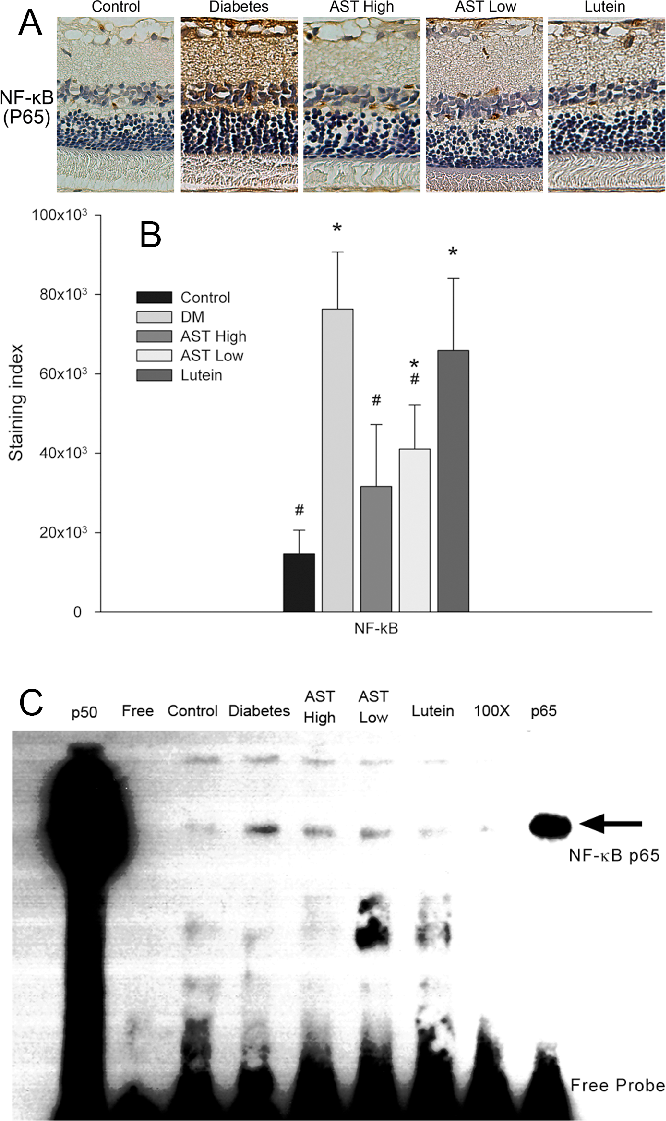
Western blot or protein expression analysis of retinal inflammatory and oxidative stress markers in the diabetic rat model, demonstrating the molecular effects of astaxanthin treatment on key signaling proteins.
Astaxanthin Inhibits Expression of Retinal Oxidative Stress and Inflammatory Mediators in Streptozotocin-Induced …
Gene or protein expression data for retinal vascular endothelial growth factor (VEGF) or related angiogenic markers in AST-treated versus untreated diabetic rats.
Astaxanthin Inhibits Expression of Retinal Oxidative Stress and Inflammatory Mediators in Streptozotocin-Induced …
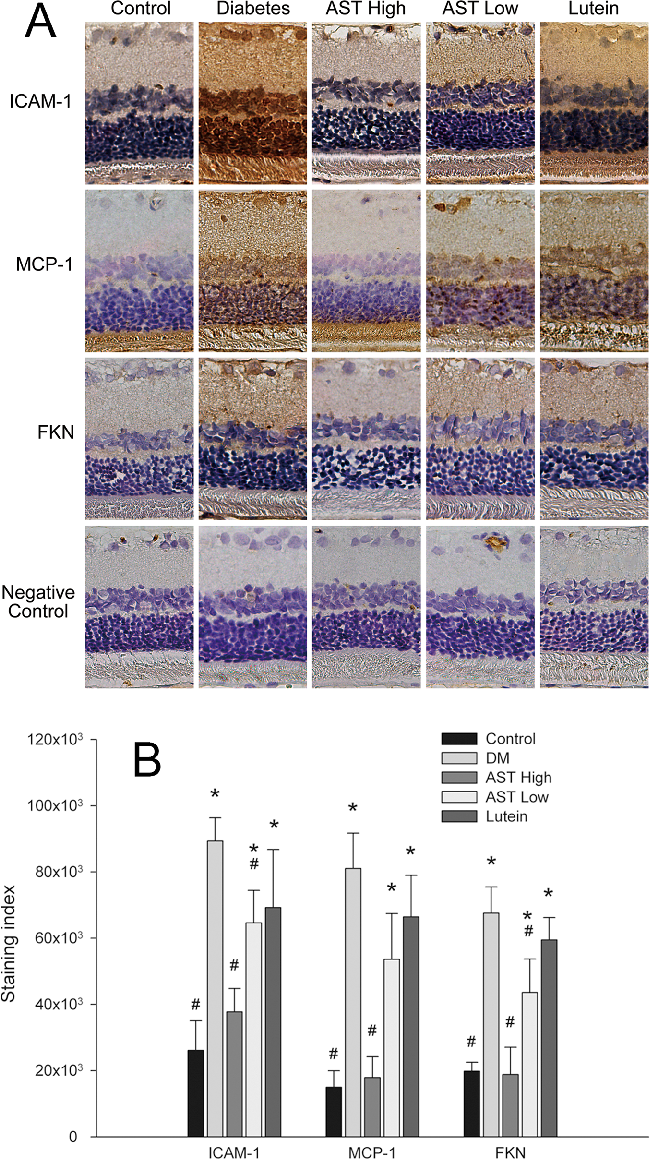
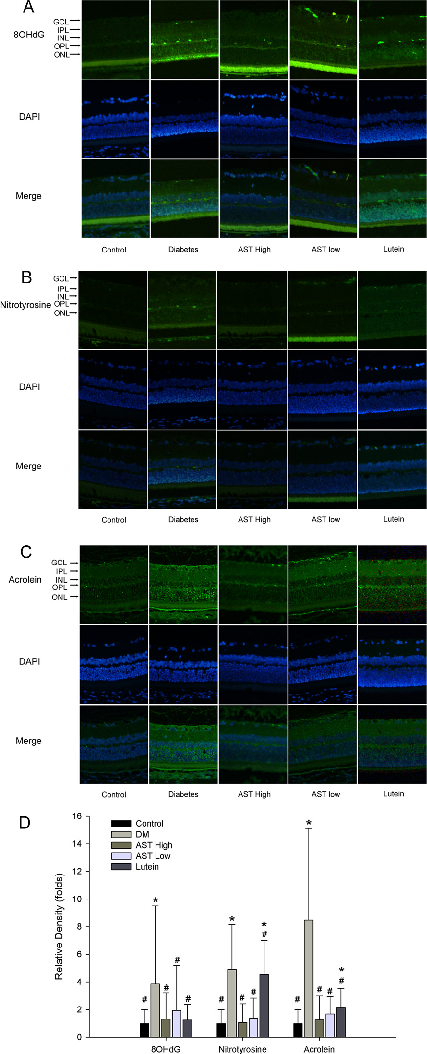
Histological or immunohistochemical analysis of retinal tissue sections from diabetic rats, comparing structural changes across treatment groups to assess astaxanthin's protective effects on retinal architecture.
Astaxanthin Inhibits Expression of Retinal Oxidative Stress and Inflammatory Mediators in Streptozotocin-Induced …
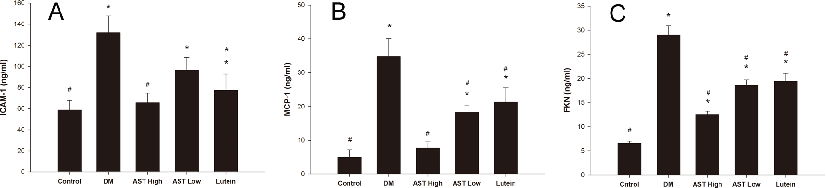
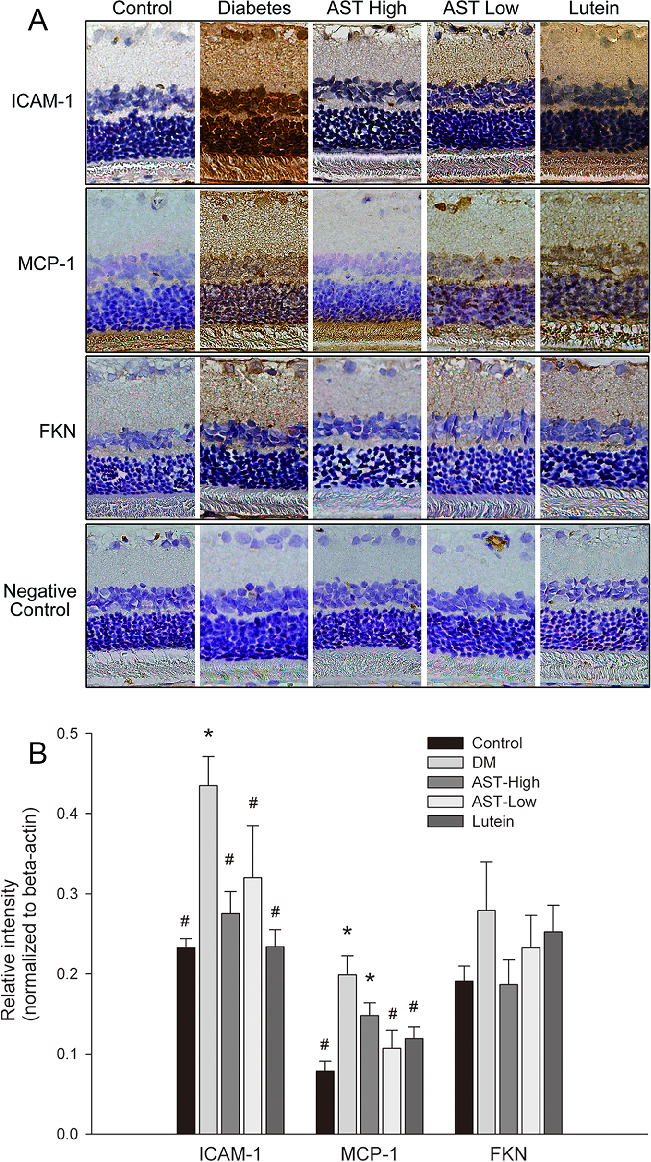
Quantification of ICAM-1, MCP-1, and fractalkine (FKN) protein levels in aqueous humor of diabetic rats treated with astaxanthin or lutein. Reduced expression of these inflammatory mediators suggests AST may attenuate vascular inflammation in diabetic eyes.
Astaxanthin Inhibits Expression of Retinal Oxidative Stress and Inflammatory Mediators in Streptozotocin-Induced …
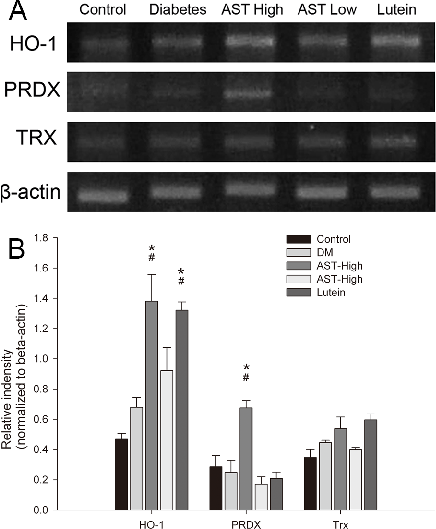
Supplementary analysis of inflammatory or oxidative markers in ocular tissues of STZ-induced diabetic rats, providing additional evidence for astaxanthin's protective mechanism against diabetic retinal damage.
Astaxanthin Inhibits Expression of Retinal Oxidative Stress and Inflammatory Mediators in Streptozotocin-Induced …
Summary of retinal protection outcomes or dose-response data for astaxanthin in the diabetic rat model, consolidating evidence that AST inhibits expression of oxidative stress and inflammatory mediators in diabetic retinopathy.
Astaxanthin Inhibits Expression of Retinal Oxidative Stress and Inflammatory Mediators in Streptozotocin-Induced …
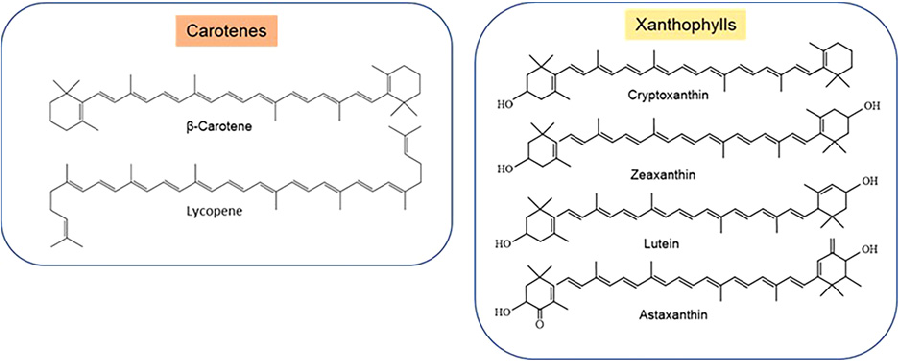
Chemical structures of common carotenes (such as beta-carotene and lycopene) and xanthophylls (including lutein, zeaxanthin, and astaxanthin). Structural differences between provitamin A and non-provitamin A carotenoids are highlighted.
Effects of carotenoids on mitochondrial dysfunction.
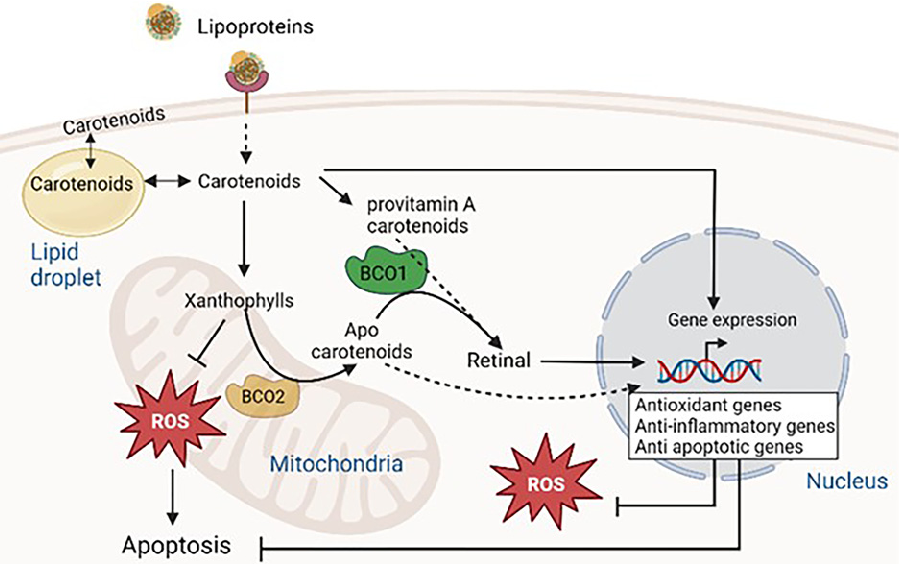
Overview of carotenoid metabolism involving BCO1 and BCO2 enzymes. Carotenoids from circulating lipoproteins enter cells through scavenger receptor class B type I, LDL receptor, and CD36, undergoing enzymatic cleavage to produce retinoids and apocarotenoids with distinct biological activities.
Effects of carotenoids on mitochondrial dysfunction.
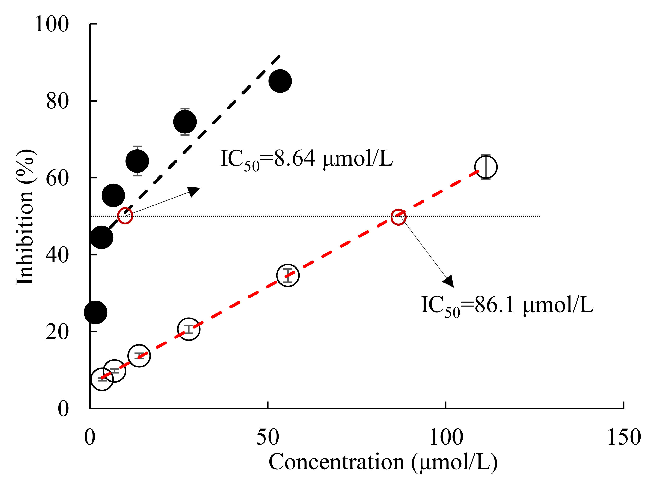
Experimental results examining simultaneous Inhibitory Effects of All, with data points illustrating key findings related to alzheimer´s disease is a global neurodegenerative health concern.
Simultaneous Inhibitory Effects of All-Trans Astaxanthin on Acetylcholinesterase and Oxidative Stress.
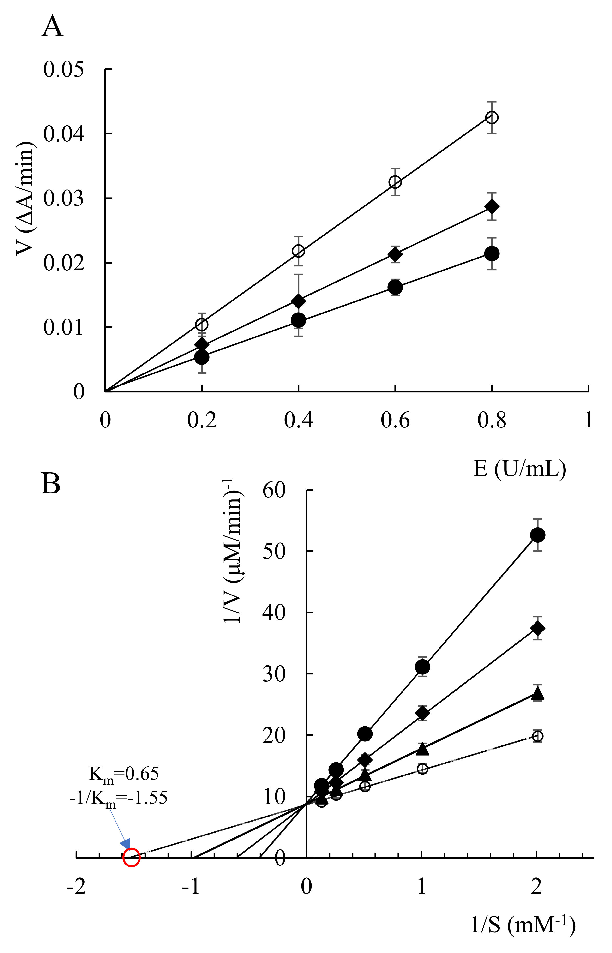
Reaction rates of acetylcholinesterase in the presence of all-trans astaxanthin with different concentrations (A), and Lineweaver–Burk reciprocal plots (B). ○: all-trans astaxanthin concentration 0 μmol/L; ▲: all-trans astaxanthin concentration 6.5 μmol/L; ◆: all-trans astaxanthin concentration 26 μmol/L; ●: all-trans astaxanthin concentration 5...
Simultaneous Inhibitory Effects of All-Trans Astaxanthin on Acetylcholinesterase and Oxidative Stress.
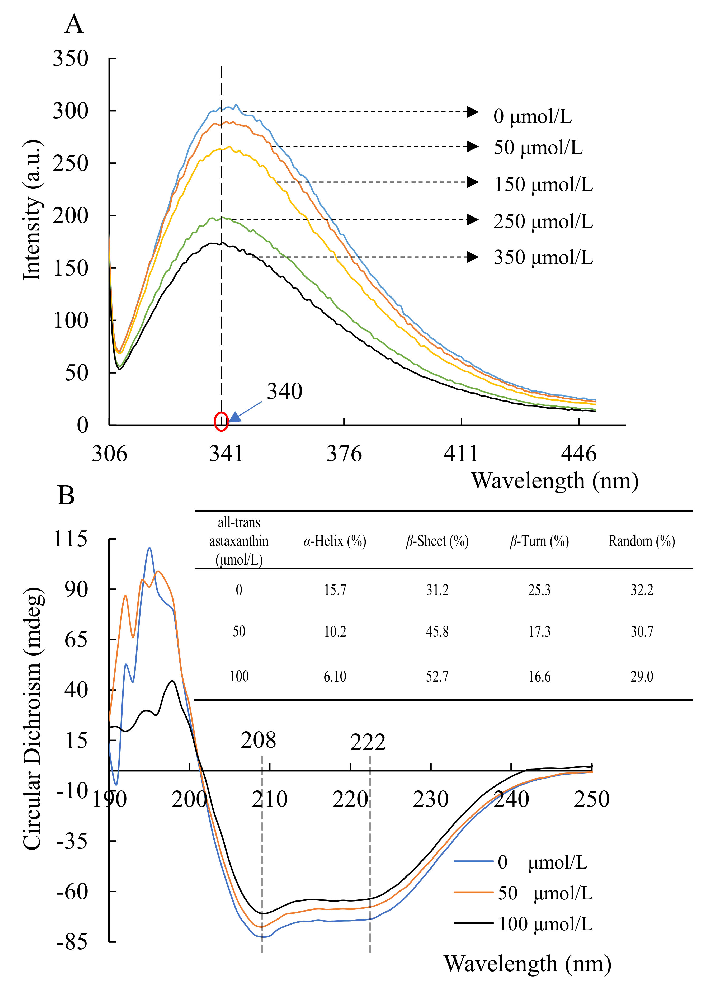
Fluorescence emission (A) and circular dichroism (B) spectra of acetylcholinesterase in the presence of all-trans astaxanthin with various concentrations.
Simultaneous Inhibitory Effects of All-Trans Astaxanthin on Acetylcholinesterase and Oxidative Stress.
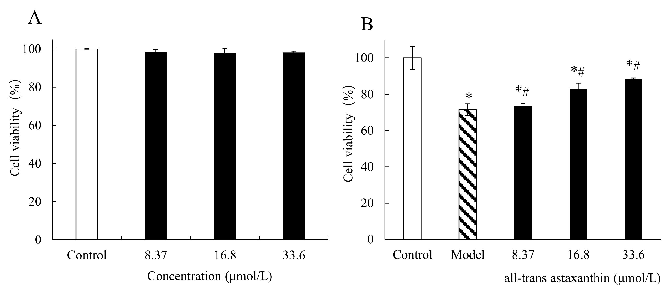
The effect of all-trans astaxanthin concentrations on cell viability in group (A) and in group (B) treated with Aβ25–35. : Control group; : astaxanthin-treatment group;
Simultaneous Inhibitory Effects of All-Trans Astaxanthin on Acetylcholinesterase and Oxidative Stress.
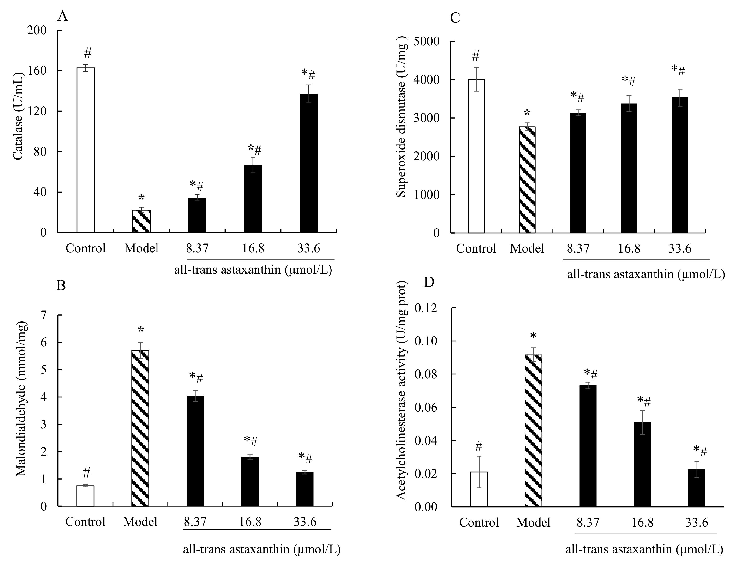
Effect of all-trans astaxanthin on intracellular antioxidant capacity and acetylcholinesterase activity. The levels of catalase (A), malondialdehyde (B), superoxide dismutase (C), and acetylcholinesterase activity (D) are shown.
Simultaneous Inhibitory Effects of All-Trans Astaxanthin on Acetylcholinesterase and Oxidative Stress.
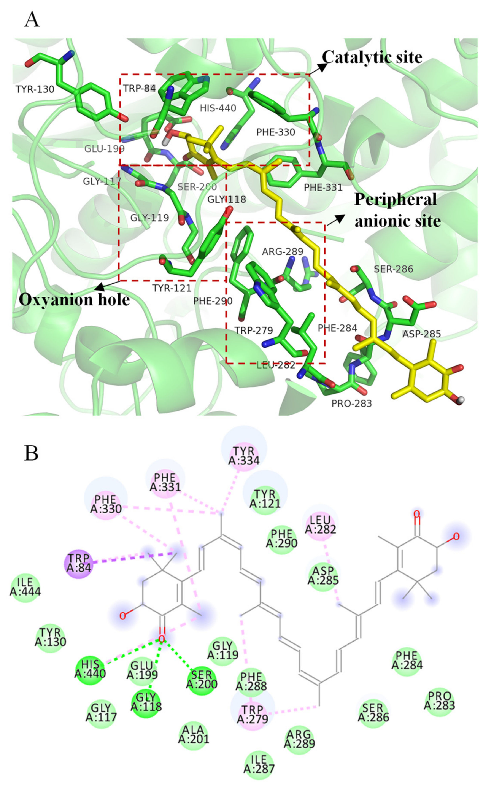
3D (A) and 2D (B) structural simulation of all-trans astaxanthin interacting with acetylcholinesterase.
Simultaneous Inhibitory Effects of All-Trans Astaxanthin on Acetylcholinesterase and Oxidative Stress.
Visual summary of the pathways and interactions relevant to the Effects of Astaxanthin on Cognitive Function and Neurodegeneration in Humans, as discussed in the context of oxidative stress is a key contributing factor in neurodegeneration, cognitive ageing, cognitive decline, and diminish.
The Effects of Astaxanthin on Cognitive Function and Neurodegeneration in Humans: A …
الصفحة 1 من 3