Increased vitamin D is associated with decline of naïve, but accumulation of effector, CD8 T cells during early aging.
Study Design
- 연구 유형
- Observational Study
- 대상 집단
- Adults during early aging
- 중재
- Increased vitamin D is associated with decline of naïve, but accumulation of effector, CD8 T cells during early aging. None
- 대조군
- None
- 일차 결과
- 25(OH)D levels and CD8 T cell subset distribution
- 효과 방향
- Mixed
- 비뚤림 위험
- Unclear
Abstract
Given the protective roles of 25-hydroxyvitamin D (25[OH]D or vitamin D) in musculoskeletal health and the potential beneficial effects of vitamin D supplementation in reducing the risk of various chronic diseases, intensive repletion of vitamin D has been widely advocated. Of note, CD8 T cells have the highest levels of the vitamin D receptor compared with other major immune cells. The effects of vitamin D on CD8 T cells during aging, however, remain unclear. This study determined the relationship between vitamin D levels and CD8 T-cell status in 34 healthy female subjects (all >60 years old). The CD8 T cell phenotype was defined by the surface expression of CD28 and CD95. The low-25(OH)D serum groups (≤30 ng/ml) had higher percentages of CD28+CD95-CD8+ (naïve) T cells and lower percentages of CD28+CD95+CD8+ (effector) T cells. By contrast, subjects with high levels of 25(OH)D had very low percentages of naïve CD8 T cells but very high percentages of effector CD8 T cells. There was a significant inverse correlation between 25(OH)D levels and the frequency of naïve CD8 T cells. The results show that higher levels of vitamin D are correlated with decreased frequencies of naïve CD8 T cells during early aging, suggesting that higher levels of 25(OH)D accelerate CD8 T-cell senescence. These results warrant the further evaluation of the effects of vitamin D supplementation in immune aging.
요약
Higher levels of vitamin D are correlated with decreased frequencies of naïve CD8 T cells during early aging, suggesting that higher levels of 25(OH)D accelerateCD8 T-cell senescence.
Full Text
Increased vitamin D is associated with decline of naïve, but accumulation of effector, CD8 T cells during early aging
Yong Gil Hwang1, Hui-Chen Hsu1, Fei Chu Lim1, Qi Wu1, PingAr Yang1, Gordon Fisher2, Gary R. Hunter2, John D. Mountz1,3*
1University of Alabama at Birmingham, Division of Clinical Immunology and Rheumatology, Birmingham, AL, USA 2Department of Human Studies, University of Alabama at Birmingham, Birmingham, AL, USA 3Birmingham VA Medical Center, Birmingham, AL, USA; *Corresponding Author: [email protected]
Received 13 March 2013; revised 13 April 2013; accepted 20 April 2013 Copyright © 2013 Yong Gil Hwang et al. This is an open access article distributed under the Creative Commons Attribution License, which permits unrestricted use, distribution, and reproduction in any medium, provided the original work is properly cited.
ABSTRACT
Given the protective roles of 25-hydroxyvitamin D (25(OH)D or vitamin D) in musculoskeletal health and the potential beneficial effects of vitamin D supplementation in reducing the risk of various chronic diseases, intensive repletion of vitamin D has been widely advocated. Of note, CD8 T cells have the highest levels of the vitamin D receptor compared with other major immune cells. The effects of vitamin D on CD8 T cells during aging, however, remain unclear. This study determined the relationship between vitamin D levels and CD8 T cell status in 34 healthy female subjects (all >60 years old). The CD8 T-cell phenotype was defined by the surface expression of CD28 and CD95. The low-25(OH)D serum groups (≤30 ng/ml) had higher percentages of CD28+CD95–CD8+ (naïve) T cells and lower percentages of CD28+CD95+CD8+ (effector) T cells. By contrast, subjects with high levels of 25(OH)D had very low percentages of naïve CD8 T cells but very high percentages of effector CD8 T cells. There was a significant inverse correlation between 25(OH)D levels and the frequency of naïve CD8 T cells. The results show that higher levels of vitamin D are correlated with decreased frequencies of naïve CD8 T cells during early aging, suggesting that higher levels of 25(OH)D accelerate CD8 T cell senescence. These results warrant further evaluation of the effects of vitamin D supplementation in immune aging.
Keywords: Naïve CD8; Immunosenescence;
Vitamin D; Human
1. INTRODUCTION
Aging is accompanied by immunologic and endocrinologic changes. The former are associated with both a gradual loss of naïve T cells and an accumulation of memory or senescent T cells [1,2]. Senescent CD8 T cells, which have high levels of killer Ig-like receptor (KIR) and short telomeres, are associated with increased prevalence of carotid artery lesions and adverse health outcomes [3,4]. In addition, a substantial proportion of the elderly population have suboptimal 25-hydroxyvitamin D (25(OH)D) concentrations from the perspective of bone heath and possibly other chronic diseases, including cancer, cardiovascular disease, diabetes, autoimmune disease, and Alzheimer’s disease [5-13]. A potentially beneficial role of vitamin D supplementation in reducing the risk of various chronic diseases has been widely accepted based on observational studies, but to our knowledge, there has been no large, long-term, randomized trial. Furthermore, the optimal serum concentration of 25(OH)D is still controversial, and possible effects of high levels of 25(OH)D on the aging process remain a possibility. The majority of in vitro and epidemiologic studies suggest that the optimal serum concentration of 25(OH)D is 30 ng/ml or greater for maintaining bone mineral density (BMD), lower-extremity function, and dental health and minimizing the risk of falls and fractures [14-16]. However, the underlying rationale for setting the lower limit of the normal range at 30 ng/ml is being questioned, given substantial individual variation in the PTH response to 25(OH)D and insufficient data to establish absolute cutoff levels of 25(OH)D for maximal calcium absorption [17-19]. Recent studies
have shown a U-shaped association between 25(OH)D concentrations and adverse outcomes [17] and those associated with oral administration of high-dose cholecalciferol [20]. In addition, experimental studies have shown that not only low but also high 25(OH)D concentrations can accelerate aging and be deleterious to health [21,22].
The effects of vitamin D are mediated through its interaction with a high-affinity nuclear vitamin D receptor (VDR), a member of the nuclear receptor superfamily of ligand-activated transcription factors [23,24]. Brain, prostate, breast, and colon tissues, among others, as well as immune cells express a VDR. Interestingly, among immune cells (CD4, CD8, B cells, and macrophages), it was noted that CD8 T cells express the highest concentrations of VDR [25]. Naïve T cells do not express VDR, but it was induced by T cell receptor (TCR) signaling via the alternative mitogen-activated protein kinase p38 pathway. This initial TCR signaling via p38 leads to successive induction of VDR and phospholipase C-γ1 (PLC-γ1), which are required for subsequent classical TCR signaling and T cell activation. Thus, vitamin D exhibits a unique function in enhancing TCR signaling [26]. By contrast, in autoimmune mice, administration of vitamin D prevented development of autoimmune encephalomyelitis (EAE), suggesting that in chronically stimulated T cells, vitamin D acts as a suppressor rather than an activator [27].
Our understanding of the effects of vitamin D on CD8 T cells during aging remains limited. Given the reported adverse health outcomes associated with T cell sensecence [3,4] and high vitamin D concentration [28,29], we investigated the relationship between serum 25(OH)D concentration and CD8 T cell populations in healthy young elderly women.
Our previous studies have identified specific biomarkers for naïve (CD28+CD95), effector (CD28+CD95+) and senescent (CD28CD95+) CD8 T cells [30]. Briefly, we verified these phenotypes by measuring the relative number of T cell receptor recombination excision circles (TRECs), which decline with cellular proliferation and with thymic involution. In addition, we assessed the expression of CD45RA, which is an established marker of resting naïve T cells, and CD45RO, which is a marker of activation commonly found on memory and effector cells for each phenotype [31]. We also analyzed the expression of CD127 (the IL-7R alpha chain), which is expressed on all mature CD8+ T cells after emigration from the thymus. Dow-nregulation of CD127 is associated primarily with T cell activation, whereas memory cells express high levels of CD127 [32]. From these data, we showed that CD28+CD95−CD8+ T cells are primarily composed of naïve CD8+ T cells, that the CD28+CD95+ CD8+ T cells are largely composed of memory cells, and that the CD28−CD95+CD8+ T cells are predominantly
composed of terminally differentiated effector memory CD8 T cells [30]. Using these markers, we found in this study that the frequency of naïve CD8 T cells in peripheral blood mononuclear cells (PBMC) exhibited a significant negative correlation with circulating levels of 25(OH)D.
2. MATERIALS AND METHODS
- 2.1. Subjects
- 2.2. Purification and Preparation of Peripheral Blood Mononuclear Cells (PBMCs)
- 2.3. Measurements
Serum 25(OH)D levels were determined by using the 25(OH)D ELISA Kit (intra-assay coefficient of variation,
3.34%, Inter Medico). Serum levels of inflammatory
cytokines IFN-γ, IL-1, IL-6, and IL-17 and the Th2 cytokine IL-4 were determined by ELISA. Blood pressure, lipid profile, and body composition data were measured. Body fat and bone density were determined by dual-energy X-ray absorptiometry.
2.4. Cell Phenotypes
Cell phenotypes were examined by standard flow cytometry procedures as previously described [30]. This involved six-color immunofluorescence staining of cell samples using a combination of FITC-, PE-, and APCconjugated secondary antibodies for anti-CD8, antiCD95, anti-CD28, anti-CD62L, anti-CD127, and antiCCR7 primary antibodies. Naïve and senescent CD8 cells were determined based on expression of CD28 and CD95 (Fas) [30]. CD62L, CD127, and CCR7 expression was measured in each group (CD28+CD95 CD8+ T cells, CD28+CD95+CD8+ T cells, CD28−CD95+CD8+ T cells). Each experiment included cells incubated with isotype controls. A total of 100,000 events for each sample were recorded and analyzed on an LSRII flow cytometer (BD Biosciences). The analysis was performed using FlowJo Software (TreeStar, Ashland, CA). Forward-angle light scatter was used to exclude dead and aggregated cells [30].
2.5. Determination of T Cell ProliferativeResponse
PBMCs were resuspended in RPMI 1640 complete medium supplemented with 10% FCS, 50 mM 2-ME, 25 mM HEPES-buffered saline, 2 mM glutamine, 100 U/ml penicillin, and 100 mg/ml streptomycin and were stimulated with phytohaemagglutinin (PHA) at a concentration of 10 µg/ml. Proliferation of PBMCs after PHA stimulation was determined using the [3H]-thymidine incorporation method, as we previously described [33, 34]. Briefly, the PBMC cultures were pulsed with [3H]thymidine (Amersham Pharmacia Biotech) 18 h before harvest. Proliferation was estimated by measuring the incorporation of [3H]-thymidine into the cells on days 3 (D3 PHA) and 7 (D7 PHA) after stimulation and after addition of anti-Fas antibody at day 2 (D3 PHA+antiFas) and 4 (D7 PHA+anti-Fas) to induce apoptosis. We were unable to analyze some of the 34 subjects for the proliferation assay (6 subjects) and cytokine assay (8 subjects) due to low baseline cell counts or small sample volumes.
2.6. Measurement of Lipid Profile
These were carried out using the Ektachem DT II system as described by Hunter, et al. [35]. With this system, highdensity lipoprotein-cholesterol (HDL-C) is measured after precipitation of low-density lipoprotein (LDL) and
very low-density lipoprotein (VLDL) with dextran sulfate and magnesium chloride. Control sera with low and high substrate concentrations were analyzed with each group of samples, and values for these controls were required to fall within accepted ranges before samples were analyzed. The DT II instrument was calibrated every 6 months with reagents supplied by the manufacturer. LDL was estimated using the Friedewald formula [36].
2.7. Statistical Analysis
The results are expressed as the mean and standard deviation (SD). The two-tailed Student’s t-test and paired t-test were used for comparison between high- and low25(OH)D groups. A partial correlation coefficient controlling for total body fat and/or age was calculated for the association between 25(OH)D levels and frequencies of naïve CD8 T cells. A one-way analysis of variance (ANOVA) was used when more than two groups of samples were compared. Repeated measurements of ANOVA were used to compare proliferative responses and activation-induced cell death between 25(OH)D groups. Multiple linear regressions were used to determine whether age and/or total body fat had an effect on the association between 25(OH)D levels and frequencies of CD8 T cells. Raw data for cytokines were normalized by logarithmic transformation for statistical analysis. P < 0.05 was considered to be a statistically significant difference or correlation.
3. RESULTS
3.1. CD28+CD95−CD8+ T Cells Express HighLevels of CCR7, CD127, and CD62L
As we demonstrated in our previous study [30], the pool of CD28+CD95−CD8+ T cells is mainly composed of naïve CD8+ T cells, which have high expression of CD45RA and CD127 and high numbers of TREC+ cells. In this study, we analyzed the expression of CD62L, CD127, and CCR7, which are highly expressed in resting, naïve T cells [37]. We confirmed that the CD28+CD95– subpopulation of CD8 T cells expresses higher levels of CCR7, CD127 and CD62L compared with CD28+CD95+ and CD28–CD95+ subpopulations of CD8+ T cells (Figure 1). Although there are overlaps among subpopulations of CD8+ T cells, we showed that differrential expression of CD28 and CD95 allows for the identification of naïve, memory, and senescent (terminally differentiated memory) CD8+ T cell subsets.
3.2. CD28+CD95−CD8+ T Cell FrequenciesAre Higher in the Low-25(OH)D(≤30 ng/ml) Group
Among the 34 subjects analyzed for this study, 19 par-
- Figure 1. CCR7, CD127, and CD62L expression (%) among CD8 T cell phenotypes (subjects n = 28). Error bars represent the standard error of the mean (SEM).
ticipants (56%) had hypovitaminosis (≤30 ng/ml, mean 23.7 ± 4.8), and 15 participants (44%) had >30 ng/ml (mean 42.2 ± 10.3) serum levels of vitamin D. There was no statistically significant difference in age, race, BMI, total body fat, lipid profile, or bone density between the two groups, although the low-25(OH)D group had a higher percentage of African-American (high-25(OH)D group, 6.2%; low-25(OH)D group, 23.3%) and a higher mean age (Table 1). However, 25(OH)D levels were inversely correlated with the frequency of naïve CD8 T cells (partial correlation coefficient, −0.362, p = 0.049, controlled for total body fat; partial correlation coefficient, −0.422, p = 0.023, controlled for total body fat and age, Figures 2(a) and (b)).
There was a statistically significant higher percentage of CD28+CD95 CD8+ (naïve) T cells (13.3 ± 11.5%, p = 0.037) and lower percentage of CD28 CD95 CD8 (effector) T cells (36.2 ± 12.1%, p = 0.004) in subjects with lower levels of 25(OH)D. By contrast, subjects with higher levels of 25(OH)D exhibited very low percentages of naïve CD8 T cells (6.5 ± 6.0%) but very high percentages of CD28 CD95 effector CD8+ T cells (51.5 ± 16.4%, Figure 2(c)). Using a linear regression analysis, there was no statistical correlation between the frequentcies of effector CD8 T cells and levels of 25(OH)D (R = 0.287, p = 0.099, n = 34). The percentage of naive CD8+ T cells remained different between the two groups when adjusted for age and/or total body fat (%). Although there were increased frequencies of CD28 CD95+CD8+ (senescent) T cells in the low-25(OH)D group (low-25[OH]D group, 38.0 ± 19.5%; high-25(OH)D group, 26.2 ± 12.0%, p = 0.44), this difference between the two groups was not significant when adjusted for age and body fat (p = 0.254, Figure 2(c)). Furthermore, although there was no statistically significant difference in race between the two groups, there was an increased frequency of African-American women in the low-25(OH)D group (low-
25(OH)D group, 33.3%; high-25(OH)D group, 6.2%). When data sets only from Caucasian women (n = 28) were analyzed, the results, though suggestive of similar trends, did not achieve a statistically significant difference in the frequency of naïve CD8+ T cells (low25(OH)D group, 12.6%; high-25(OH)D group, 5.9%, p = 0.073) and senescent CD8+ T cells (low-25(OH)D group, 35.2%; high-25(OH)D group, 26.4%, p = 0.148) between the two groups (n = 15 and n = 13 for the high-25(OH)D group and low-25(OH)D group, respectively). However, the difference in effector T cells remained significant in Caucasian women (low-25(OH)D group, 38.8%; high25(OH)D group, 52.5%, p = 0.02, Figure 2(d)).
3.3. T Cell Proliferative Response and Anti-Fas Response Were Not Different between 25(OH)D Groups
One of the major changes in human T cell functions associated with aging is diminished proliferation in response to antigenic stimulation [38]. Vitamin D can exert a potent growth-inhibitory, antiproliferative or pro-differentiating action on a wide variety of cell types through binding with the nuclear vitamin D receptor (VDR) [39].
Table 1. Demographic and clinical characteristic comparison between high- and low-25(OH)D groups.
p value 25(OH)D < 30 64.9 4.3 0.386
25(OH)D level Mean SD
Age (year)
25(OH)D ≥ 30 63.8 3.2 25(OH)D < 30 66.7 0.090
Race (Caucasian %)
25(OH)D ≥ 30 93.8 25(OH)D < 30 23.1 4.1
25(OH)D (ng/ml)
25(OH)D ≥ 30 41.8 10.1 25(OH)D < 30 27.6 2.9 0.769
BMI (kg/m2)
25(OH)D ≥ 30 28.1 3.8 25(OH)D < 30 43.8 6.5 0.903
Total body fat (%)
25(OH)D ≥ 30 43.5 7.0 Total body BMD 25(OH)D < 30 1.2 0.1 0.606 (gm/cm2) 25(OH)D ≥ 30 1.1 0.1
25(OH)D < 30 203.7 52.0 0.86 Cholesterol (mg/dL)
25(OH)D ≥ 30 206.5 35.6 Triglyceride 25(OH)D < 30 118.6 46.3 0.847 (mg/dL) 25(OH)D ≥ 30 115.7 39.6
25(OH)D < 30 53.1 14.3 0.057 HDL (mg/dL)
25(OH)D ≥ 30 62.4 13.1 25(OH)D < 30 126.9 43.6 0.650
LDL (mg/dL)
120.9 30.9
- Figure 2. (a) The percentage of naïve and effector T cells was plotted against the 25(OH)D level of each individual. Each data point is the number obtained from a single individual. (b) The percentages of naïve T cells were negatively correlated with 25-hydroxy vitamin D (25(OH)D, partial correlation coefficient,
- 3.4. Various Cytokine Levels Were Not Different between 25(OH)D Groups
Assessments of T cell responses in elderly humans that indicate changes in cytokine profiles and an imbalance in the production of various cytokines, such as IL-2 and IFN-γ, may reflect a dysregulation that results in a decreased proliferative response in lymphocytes with increasing age [41]. In addition, differentiation and main
tenance of CD8 T cells are influenced by the cytokine milieu [42,43]. Vitamin D is an important regulator of the immune system, and effector T cell cytokine production is also regulated by vitamin D, which stimulates transforming growth factor (TGF) and interleukin 4 (IL-4) production [44] and reduces the production and/or expression of the Th1-associated cytokines, such as TNF-α and IFN-γ, in T cells [45-47]. Therefore, we measured and compared cytokine levels according to T cell phenoltypes and serum 25(OH)D levels. However, there were no significant associations between various cytokine levels and CD8 T cell phenotypes. In addition, cytokine levels were not statistically different between the two 25(OH)D groups, although the high-25(OH)D group exhibited higher levels of IL-4, IL-6, and IL-17 as well as lower levels of IL-1 (Figure 4(a)). Caucasian women had consistently higher levels of cytokines than African-American women, but statistical comparison was limited due to the discrepancy in sample size (Figure 4 (b)).
4. DISCUSSION
This is the first study showing that higher 25(OH)D levels are associated with decreased frequencies of naïve T cells and increased frequencies of effector T cells in the young elderly. The wide distribution of the percen-
tages of naïve CD8 T cells with 25(OH)D levels less than 30 ng/ml suggests that lower 25(OH)D levels do not affect naïve CD8 T cells. This was expected, because naïve T cells do not express VDR. By contrast, the high25(OH)D group had a 47% lower frequency of naïve CD8 T cells compared with the low-25(OH)D group, and the frequency of naïve T cells was uniformly low in the high-25(OH)D group. This may imply that the underlying mechanisms of maintaining high vitamin D accelerates central thymic involution, thus decreasing naïve T cell production. Although lympho-hematopoietic defect or dysfunction caused by high vitamin D is very unlikely, this possibility cannot be excluded, because hematologic data were not gathered in this study. Our findings are consistent with the novel concept that phosphate and vitamin D metabolism participate in the regulation of aging [21,22,24]. The Klotho gene encodes a novel type I membrane protein of the beta-glycosidase family, functioning as an aging-suppressor gene that extends life span when overexpressed. The Klotho gene mutation in mouse results in a syndrome that resembles accelerated human aging, including a short lifespan, vascular calcifications, soft-tissue calcifications, skin atrophy, osteoporosis, and premature thymic involution as well as hypoglycemia, hyperphosphatemia, and, paradoxically, high plasma calcitriol levels [23]. However, a vitamin D-deficient diet rescued premature aging phenotypes in Klotho knockout mice [22, 24]. Hypervitaminosis D accompanied by klotho deficiency may mediate these thymic epithelial defects and also affect thymic differentiation of dendritic cells [48,49]. These in vivo studies together with our findings suggest that
vitamin D has a role in immunologic aging processes. Increased frequencies of effector T cells in the high25(OH)D group are likely due to augmented T cell signaling and T cell activation via VDR expression on T cells. Information about vitamin D supplementation was not available in this study, and it is not clear whether higher 25(OH)D levels and decreased frequencies of naïve T cells were caused by genetic differences, such as the Klotho mutation or VDR polymorphism, or by differences in environmental exposure or vitamin D supplementation. In addition, the 25(OH)D level in the study participants ranged from 13.4 to 66.9 ng/ml (31.8 ± 12.1), and the mean value of the high-25(OH)D group was only 41.77 ng/ml, which is considered to be within the upper range of normal values. Data is limited in the range of very-low and very-high 25(OH)D, and further research is needed to determine the range of deficient and toxic levels. Given the small number of participants, the naïve T cell percentages were not significantly different when analyzed only for Ca- ucasian women (n = 28, p = 0.073) but the high-25(OH)D group of Caucasian women had a 47% lower frequency of naïve T cells than the low25(OH)D group. However, African-American women had lower 25(OH)D levels (n = 6, 24.4 ± 8.2 ) with a relatively higher naïve T cell percentage (15.1 ± 11.3%). A higher naïve T cell percentage in the low-vitamin D group could be confounded by this racial difference. T cell differentiation and senescence are also regulated by neuroendorine and metabolic factors, such as GH/IGF-1, components of the mammalian target of rapamycin (mTOR) signaling pathway, and adipokines, but these were not directly measured in this study. Given the small sample size, significant individual variation, uneven racial distribution, and the narrow range of vitamin D levels in this study, we were not able to find any significant group differences in cytokine profile or proliferation/apoptosis. Analysis of the proliferative responses of subpopulations of CD8 T cells would be beneficial to determine if naïve or effector CD8 T cells from lowor high-25(OH)D group exhibit differential proliferative responses, and if modulations of the levels of 25(OH)D can affect the response. Such studies will help to identify the functional effects of vitamin D on specific populations of CD8 T cells from older subjects.
Decreased frequencies of naïve CD8 T cells and increased frequencies of effector CD8 T cells are consistently observed with aging, and this pattern is more prominent with chronic CMV antigenemia in the elderly [50] and is associated with increased mortality in nonagenarians [51]. In addition, a decreased immunologic repertoire may pose increased risk of serious infection and decreased vaccination response [52]. We observed that the high-25(OH)D group exhibited typical immunologic changes of aging in this study. There are no studies on the direct association between these immu-
nologic changes and adverse health outcomes, including all-cause mortality. Thus, it remains unclear whether these findings imply adverse effects from higher 25(OH)D levels in young elderly women. Given the current practice of vitamin D supplementation and the lack of data on extra-skeletal health, further studies on the immunologic effects of vitamin D and their related health outcomes are urgently needed.
5. ACKNOWLEDGEMENTS
The project was supported by the National Institute of Health grants R01AG027084-01, P30-DK56336, T32DK062710-07, as well as the sponsorship of the Deep South Resource Center for Minority Aging Research (1P30AG031054-01, provided by the National Institute on Aging). We thank Dr. Paul Todd for critical review of the manuscript. Flow cytometry was carried out at the UAB Comprehensive Flow Cytometry Core (P30 AR048311 and P30 AI027767).
Figures
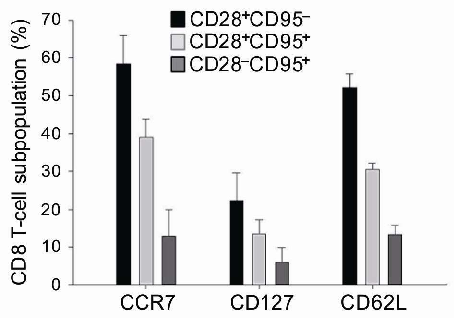
Figure 1
Correlation analysis between serum 25-hydroxyvitamin D levels and CD8 T cell subset distributions during early aging reveals that higher vitamin D is associated with decline of naive but accumulation of effector memory T cells.
chart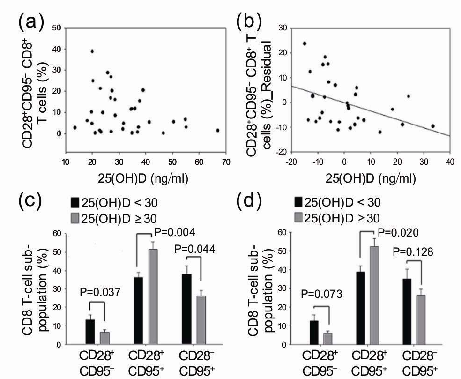
Figure 2
Flow cytometry gating strategy and representative dot plots illustrate the identification of naive, central memory, effector memory, and terminally differentiated CD8 T cell subsets based on CD45RA and CCR7 expression.
diagram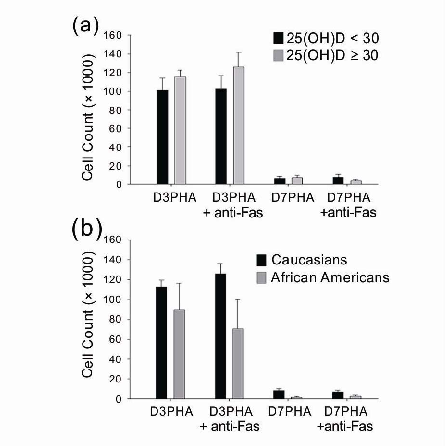
Figure 3
T cell proliferative responses and anti-Fas antibody-mediated suppression assays demonstrate that vitamin D status influences both proliferative capacity and apoptosis susceptibility of CD8 T cell subsets during aging.
chart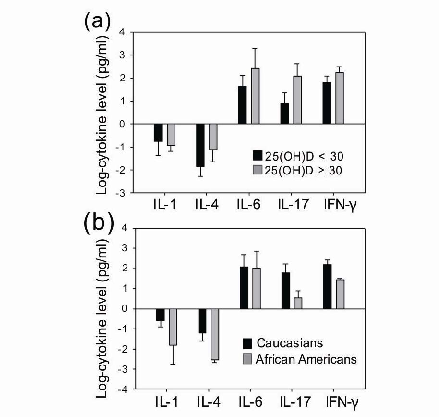
Figure 4
Cytokine levels (log-transformed) compared between 25(OH)D groups reveal differential inflammatory profiles associated with vitamin D status, with higher vitamin D linked to altered TNF-alpha and IFN-gamma production by CD8 T cells.
chartUsed In Evidence Reviews
Similar Papers
Archives of internal medicine · 2009
Association between serum 25-hydroxyvitamin D level and upper respiratory tract infection in the Third National Health and Nutrition Examination Survey.
Journal of autoimmunity · 2019
Systemic lupus erythematosus: Diagnosis and clinical management.
Journal of investigative medicine : the official publication of the American Federation for Clinical Research · 2011
Vitamin D and the immune system.
Archives of disease in childhood · 2021
Why is COVID-19 less severe in children? A review of the proposed mechanisms underlying the age-related difference in severity of SARS-CoV-2 infections.
Gastroenterology · 2010
Primary prevention of colorectal cancer.
Journal of cachexia, sarcopenia and muscle · 2020