Vitamin D 图表
32 来自同行评审研究的图表
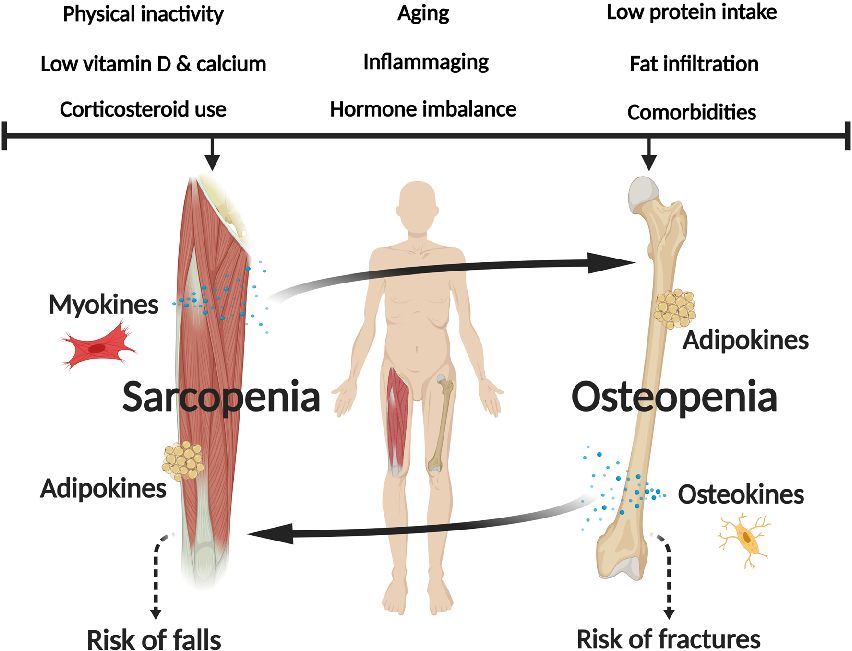
Pathophysiological mechanisms shared between osteoporosis and sarcopenia are diagrammed, including hormonal, nutritional, and mechanical loading factors.
Osteosarcopenia: epidemiology, diagnosis, and treatment-facts and numbers.
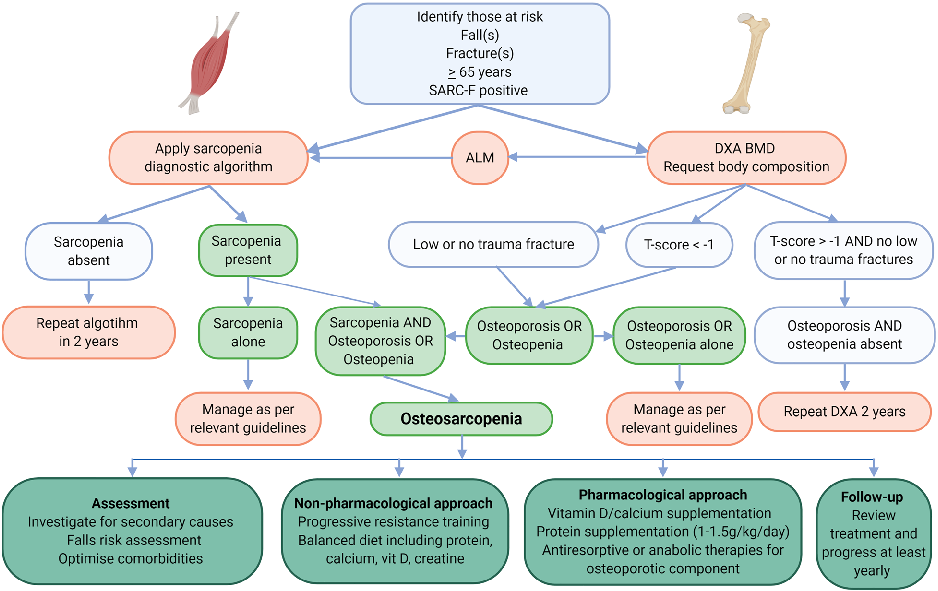
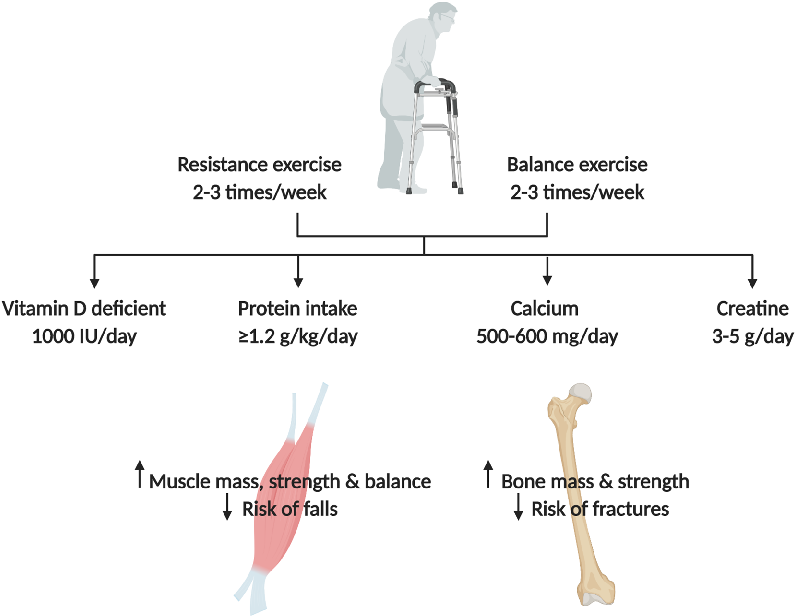
Treatment algorithms for osteosarcopenia incorporating exercise, nutritional supplementation, and pharmacological interventions are outlined.
Osteosarcopenia: epidemiology, diagnosis, and treatment-facts and numbers.
Outcome data from intervention studies targeting both bone and muscle health in osteosarcopenic patients are compared across different therapeutic approaches.
Osteosarcopenia: epidemiology, diagnosis, and treatment-facts and numbers.
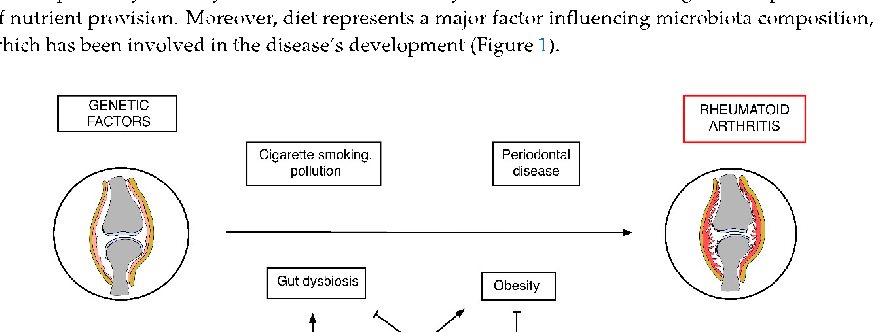
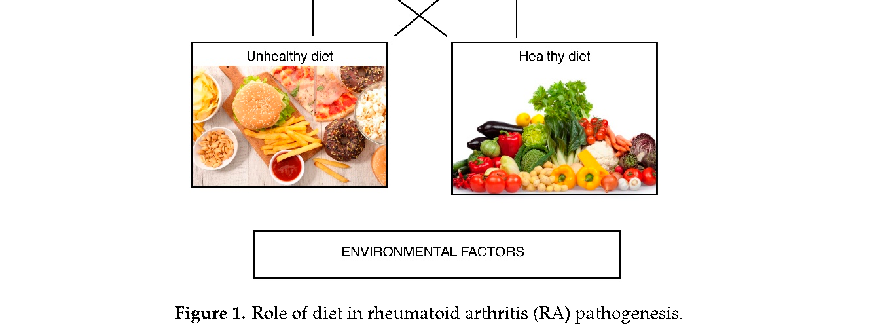
Gut microbiome composition alterations in RA patients and how dietary prebiotics and probiotics may influence disease progression.
Dietary Habits and Nutrition in Rheumatoid Arthritis: Can Diet Influence Disease Development …
Vitamin D metabolism and its immunomodulatory roles relevant to rheumatoid arthritis pathogenesis are diagrammed.
Dietary Habits and Nutrition in Rheumatoid Arthritis: Can Diet Influence Disease Development …
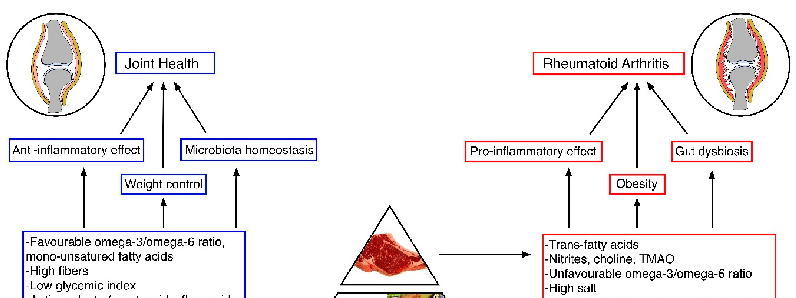
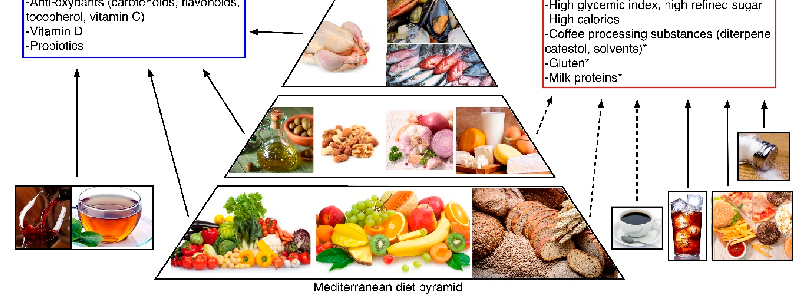
Nutrients and their food sources involved in RA development and progression are mapped, with asterisks indicating nutrients with less well-defined evidence for their role in the disease.
Dietary Habits and Nutrition in Rheumatoid Arthritis: Can Diet Influence Disease Development …
Polyphenol-rich foods and their documented anti-inflammatory mechanisms relevant to rheumatoid arthritis management are categorized.
Dietary Habits and Nutrition in Rheumatoid Arthritis: Can Diet Influence Disease Development …
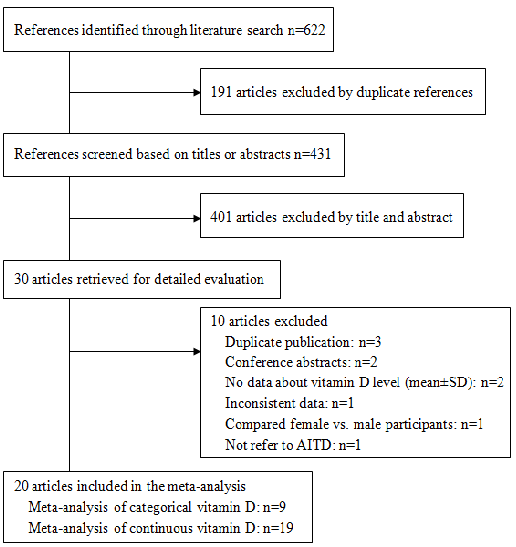
Meta-analysis results indicate that vitamin D deficiency is significantly more prevalent among patients with autoimmune thyroid disease compared to healthy controls. Lower serum 25-hydroxyvitamin D levels are associated with increased odds of both Hashimoto's thyroiditis and Graves' disease.
Meta-analysis of the association between vitamin D and autoimmune thyroid disease.
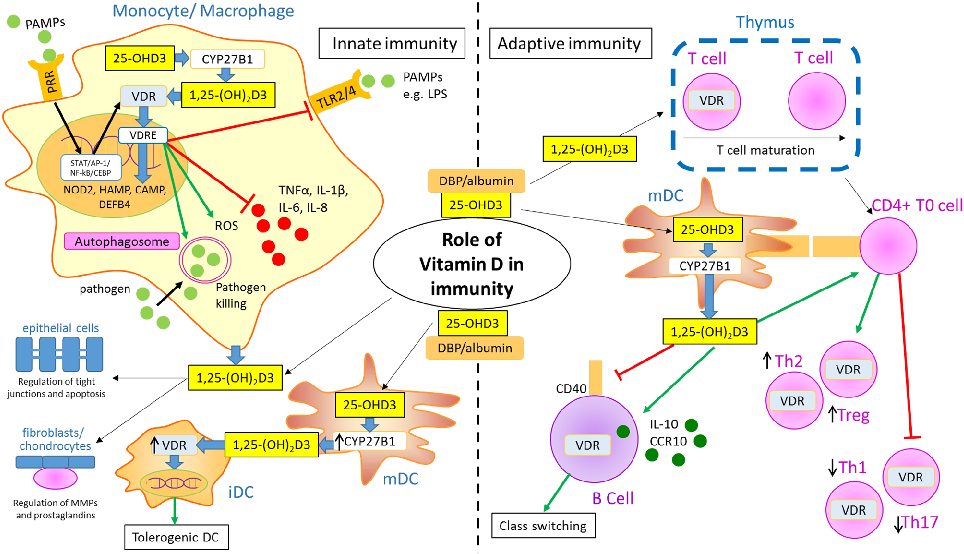
Vitamin D's immunomodulatory effects extend to multiple immune cell types relevant to rheumatoid arthritis, including T cells, B cells, dendritic cells, and macrophages. Vitamin D receptor activation promotes anti-inflammatory and tolerogenic immune phenotypes.
Vitamin D, Autoimmune Disease and Rheumatoid Arthritis.
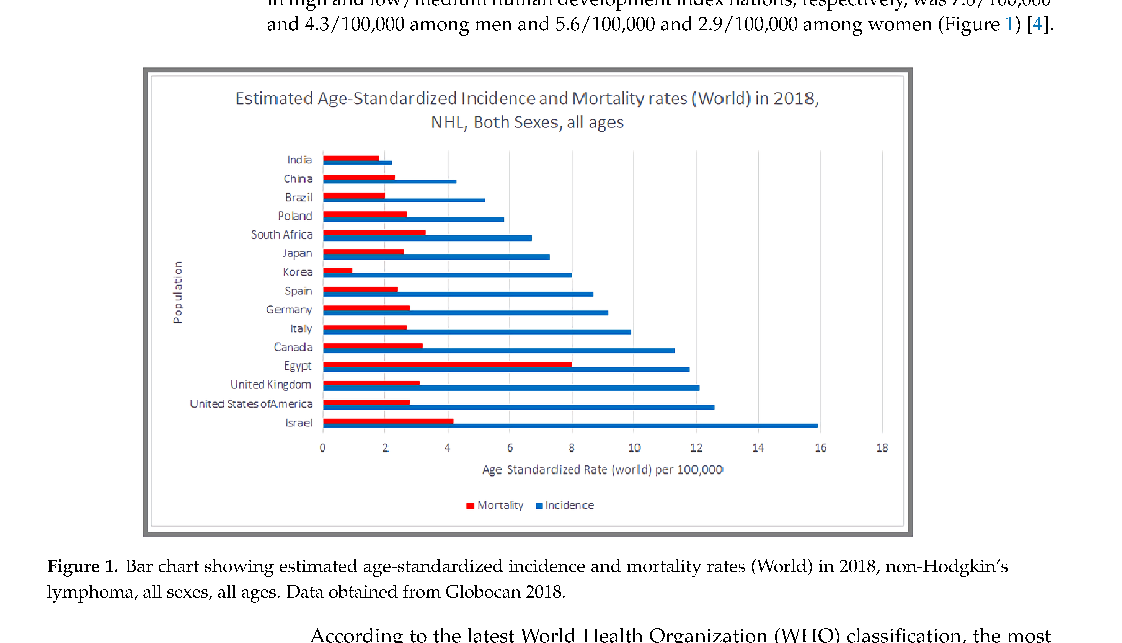
NHL mortality patterns reflect disparities in treatment access and disease subtype distribution. This figure presents survival and mortality data across different NHL classifications.
Epidemiology of Non-Hodgkin's Lymphoma.
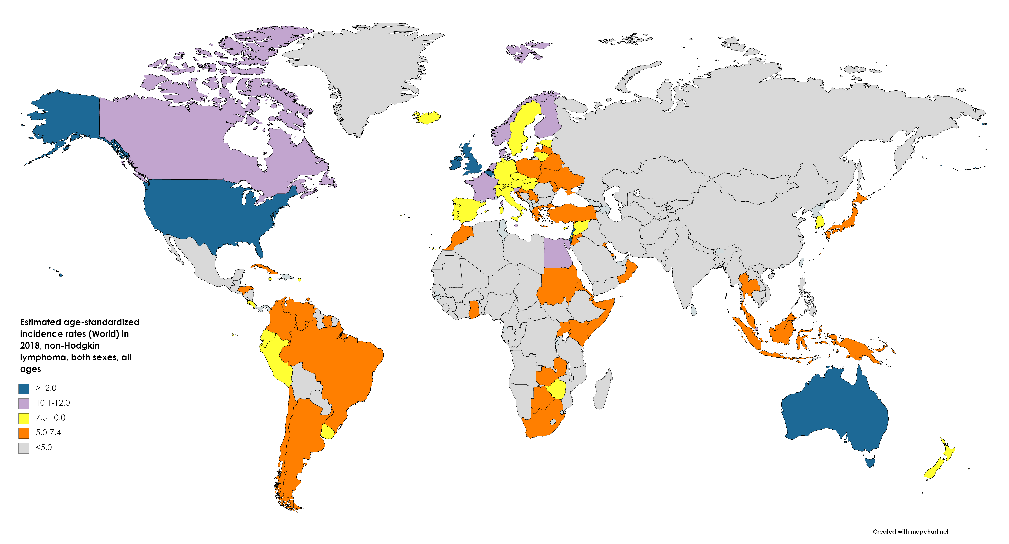
The epidemiological profile of Non-Hodgkin's lymphoma continues to evolve with improved molecular classification. This figure provides additional epidemiological data on NHL subtypes and their relative frequencies.
Epidemiology of Non-Hodgkin's Lymphoma.
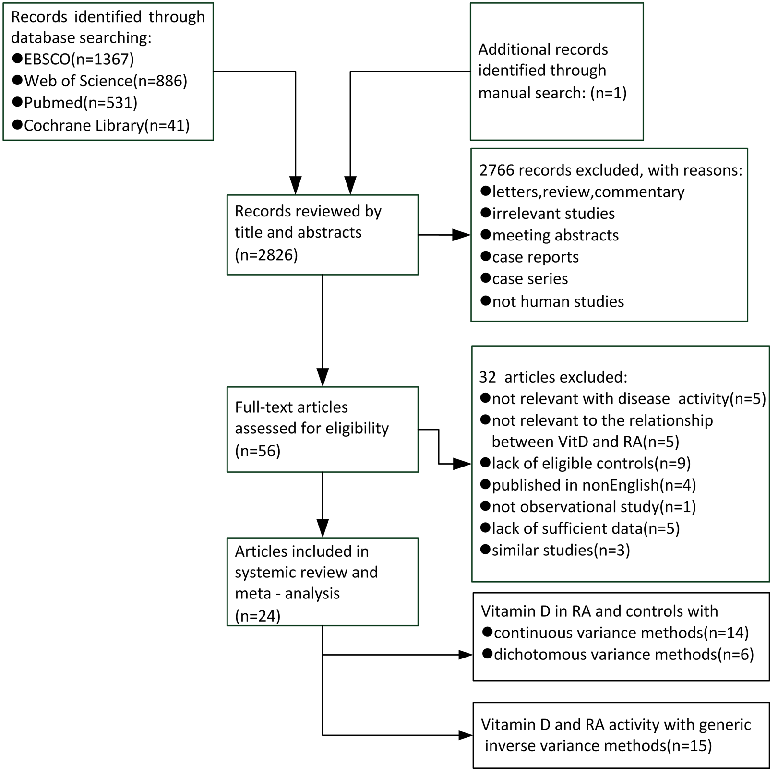
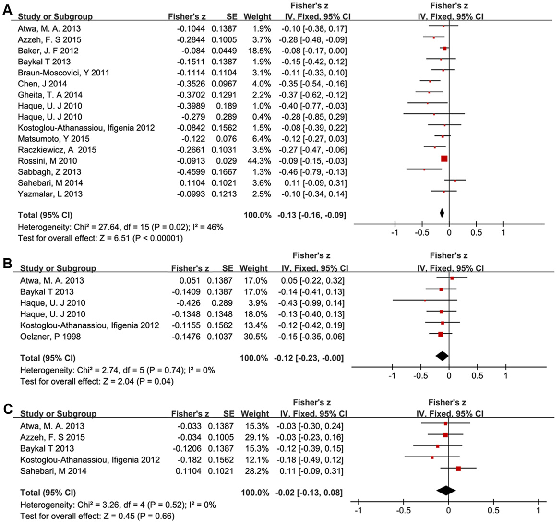
Heterogeneity among studies examining vitamin D and RA disease activity warranted sensitivity analyses. This figure presents results from leave-one-out or subgroup analyses to identify sources of between-study variation.
Serum Vitamin D Level and Rheumatoid Arthritis Disease Activity: Review and Meta-Analysis.
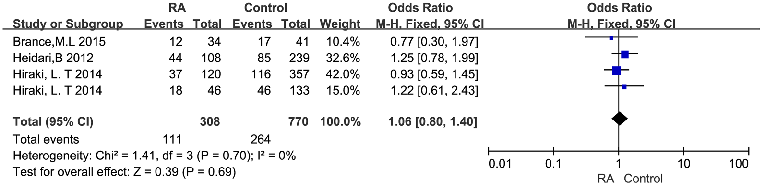
Inverse correlations between serum vitamin D levels and RA disease activity scores have been reported across multiple studies. This figure synthesizes the evidence on vitamin D deficiency as a potential modifiable risk factor in RA.
Serum Vitamin D Level and Rheumatoid Arthritis Disease Activity: Review and Meta-Analysis.
Geographic and seasonal variation in vitamin D status may confound the relationship with RA disease activity. This figure presents stratified analyses accounting for latitude, season, or supplementation status among RA patients.
Serum Vitamin D Level and Rheumatoid Arthritis Disease Activity: Review and Meta-Analysis.
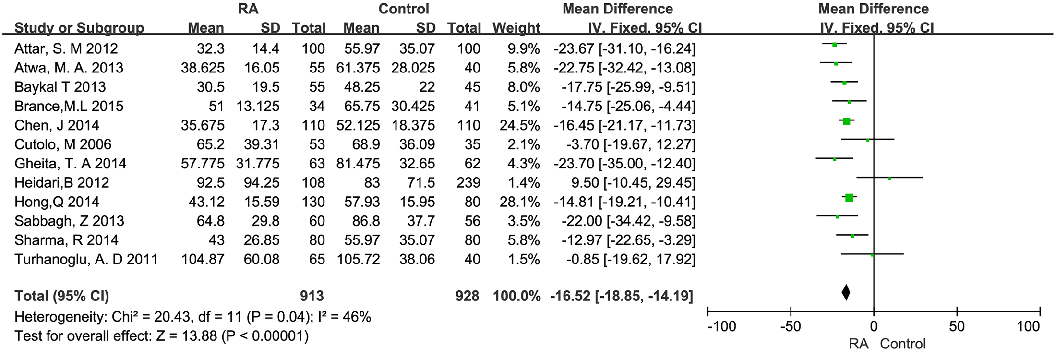
Forest plots display the relationship between serum vitamin D levels and disease activity in RA patients. Summary Fisher's z tests with 95% confidence intervals show associations between vitamin D and DAS28 scores across multiple studies.
Serum Vitamin D Level and Rheumatoid Arthritis Disease Activity: Review and Meta-Analysis.
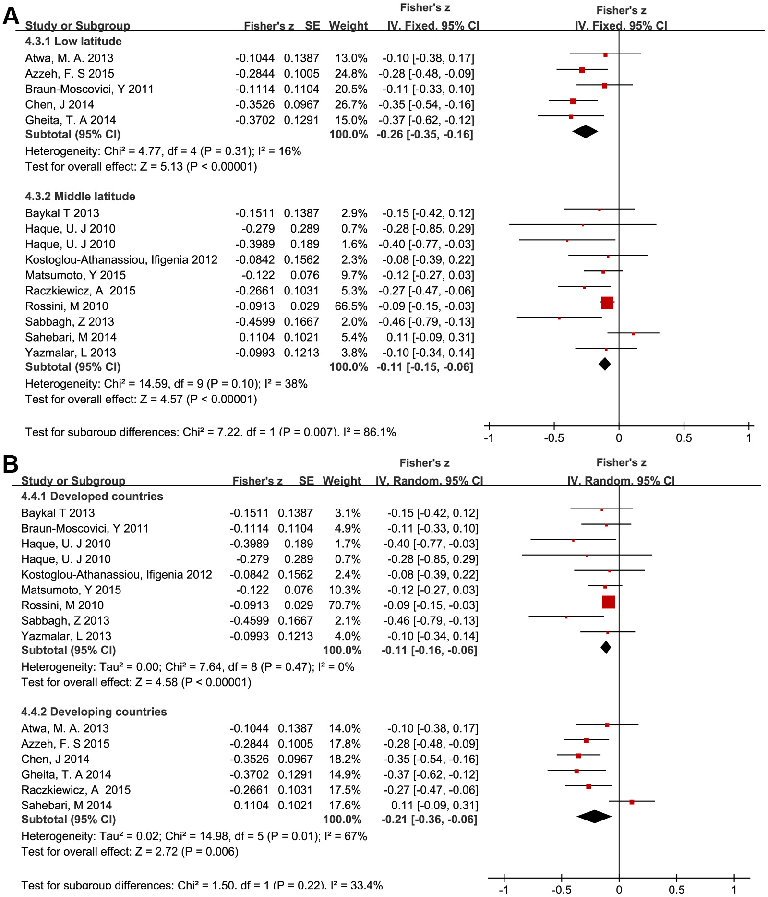
Subgroup analysis forest plots examine the vitamin D-disease activity relationship in RA patients stratified by study characteristics. Fisher's z scores with 95% confidence intervals indicate consistent inverse associations across subgroups.
Serum Vitamin D Level and Rheumatoid Arthritis Disease Activity: Review and Meta-Analysis.
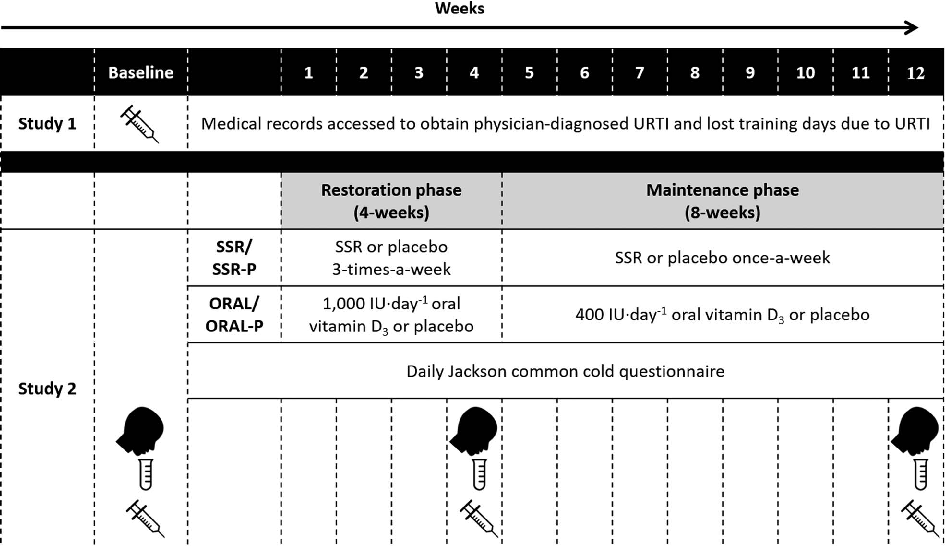
FIGURE 1—A schematic of the prospective cohort study (study 1) that investigated the association between vitamin D status (serum 25(OH)D), URTI and days lost from training, and the randomized controlled …
Influence of Vitamin D Supplementation by Simulated Sunlight or Oral D3 on …
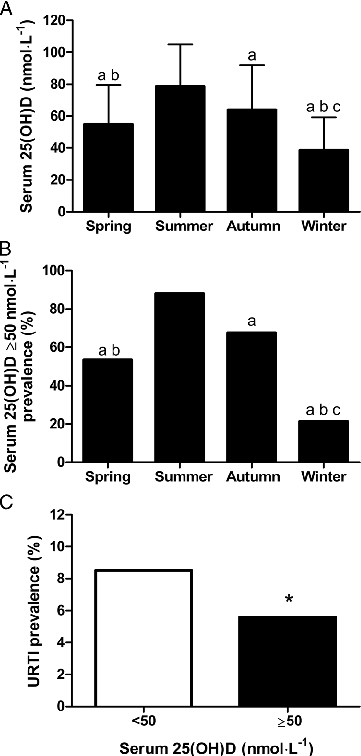
FIGURE 2—Seasonal variation in serum 25(OH)D (A), vitamin D sufficiency prevalence (serum 25(OH)D ≥50 nmol·L−1; B), and the URTI prevalence when serum 25(OH)D ≥50 nmol·L 1 or <50 nmol·L 1 …
Influence of Vitamin D Supplementation by Simulated Sunlight or Oral D3 on …
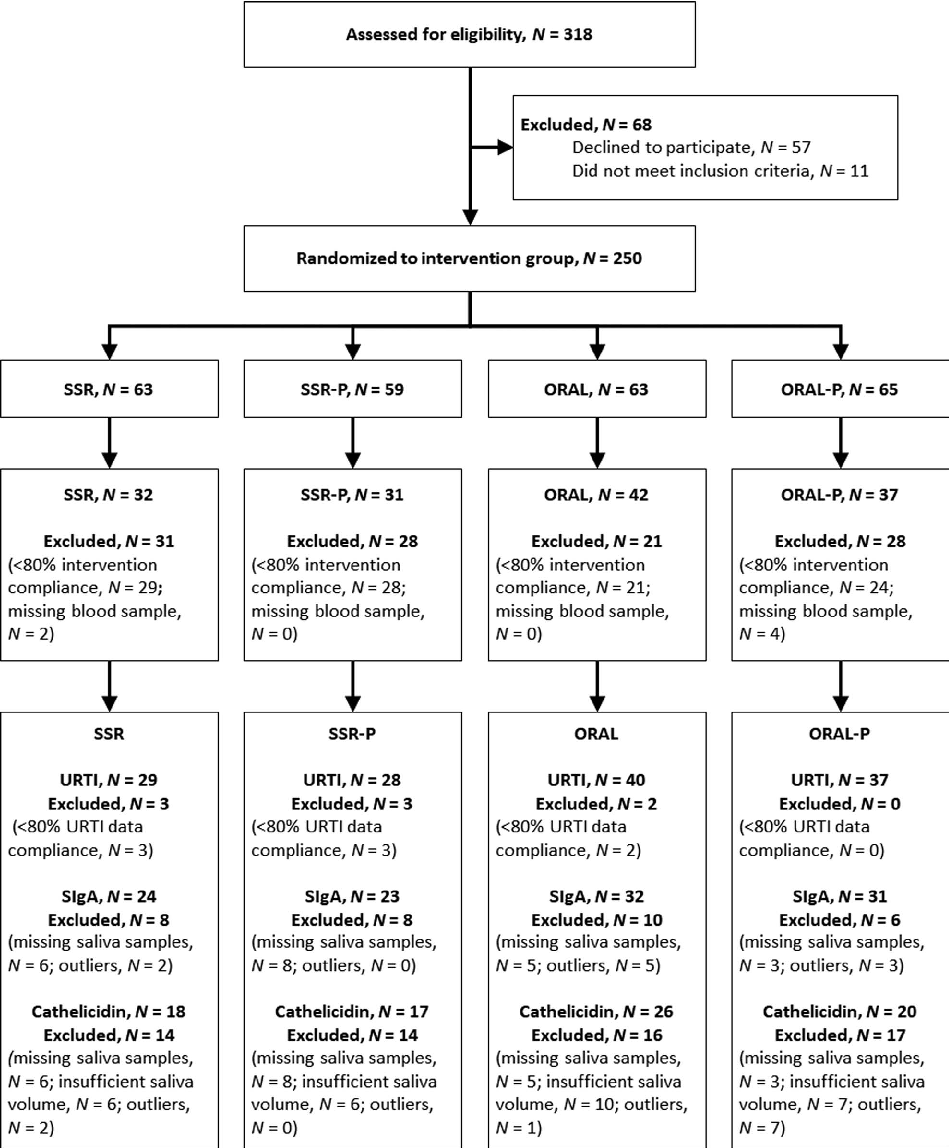
FIGURE 3—Flow diagram of the randomized controlled trial (study 2) investigating the effects of vitamin D supplementation on URTI and mucosal immunity. Flow diagram indicates the number of participants assessed, …
Influence of Vitamin D Supplementation by Simulated Sunlight or Oral D3 on …
![FIGURE 4—Serum 25(OH)D in men completing military training while receiving 12 wk of vitamin D supplementation (solar simulated radiation [SSR] or oral vitamin D3 [ORAL]) or a placebo (solar simulated radiation placebo [SSR-P] or oral placebo [ORAL-P]). Co](https://pdfs.citedhealth.com/figures/33481482/130.png)
FIGURE 4—Serum 25(OH)D in men completing military training while receiving 12 wk of vitamin D supplementation (solar simulated radiation [SSR] or oral vitamin D3 [ORAL]) or a placebo (solar simulated …
Influence of Vitamin D Supplementation by Simulated Sunlight or Oral D3 on …
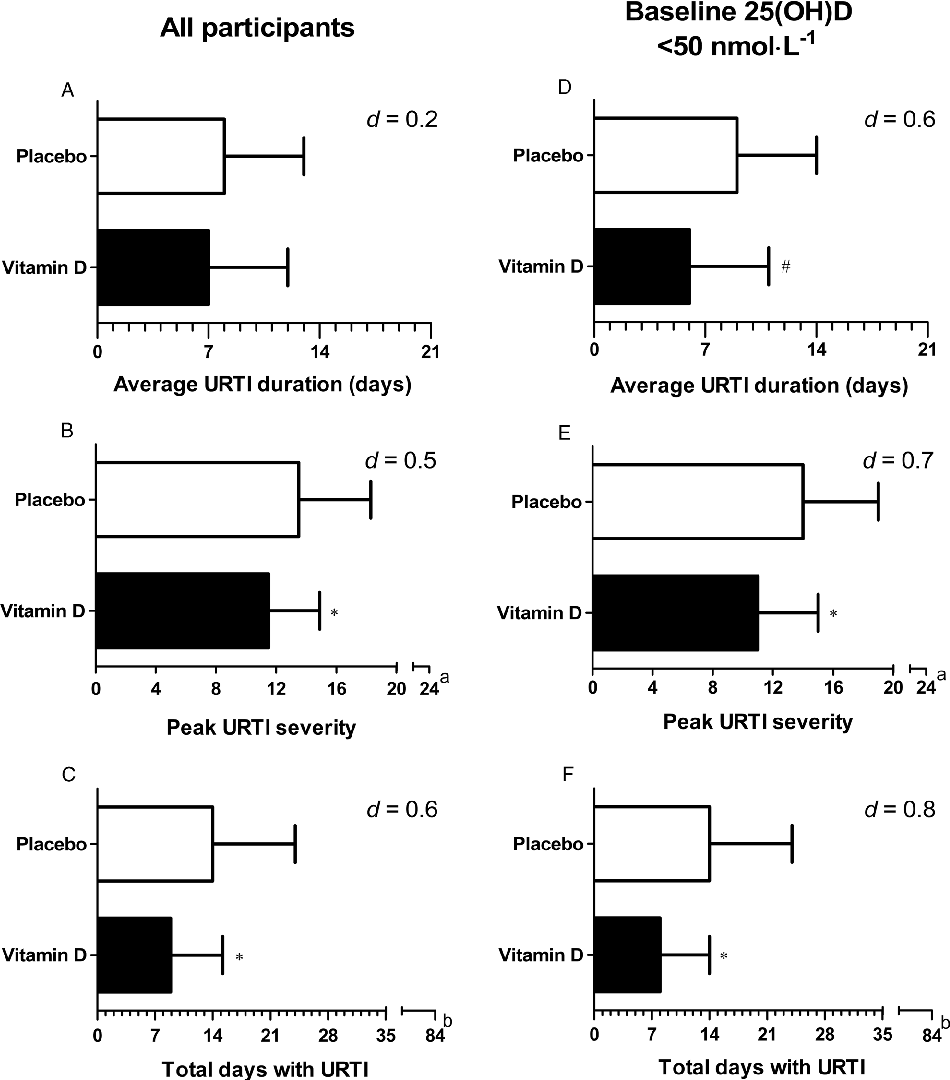
FIGURE 5—URTI average duration (A and D), peak URTI severity (B and E), and total days with URTI during military training (C and F), in the vitamin D supplementation (SSR …
Influence of Vitamin D Supplementation by Simulated Sunlight or Oral D3 on …
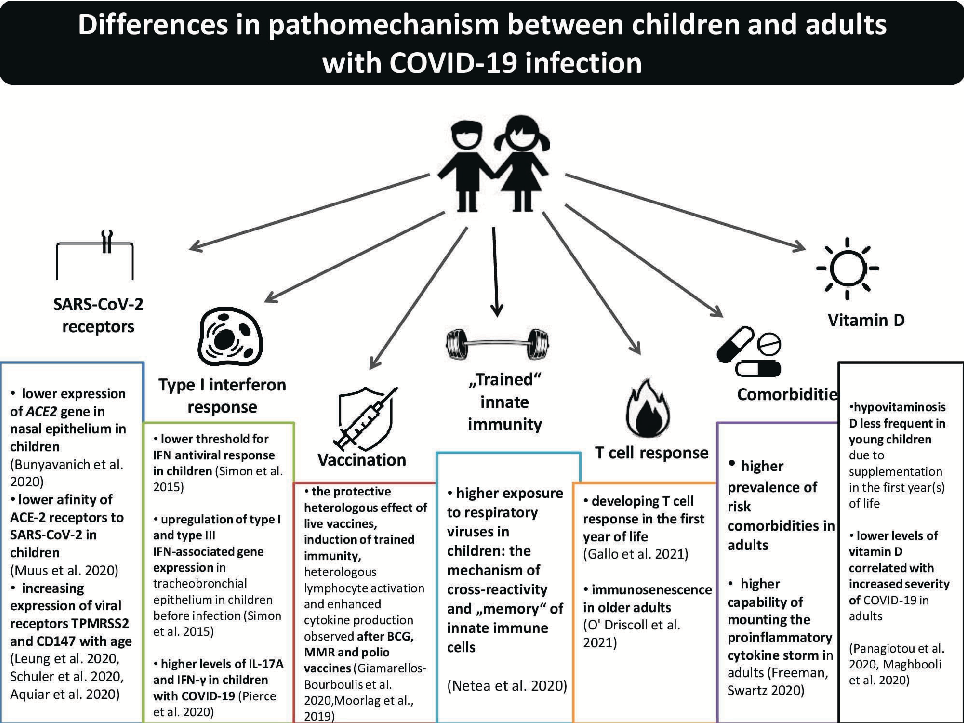
COVID-19 and the differences in physiological background between children and adults and …
COVID-19 and the differences in physiological background between children and adults and …
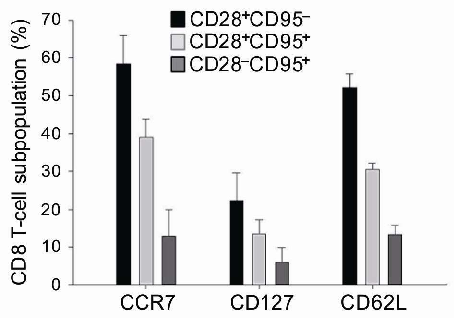
Correlation analysis between serum 25-hydroxyvitamin D levels and CD8 T cell subset distributions during early aging reveals that higher vitamin D is associated with decline of naive but accumulation of effector memory T cells.
Increased vitamin D is associated with decline of naïve, but accumulation of …
第 1 页,共 2 页