Vitamin D الأشكال
7 أشكال من أبحاث محكّمة
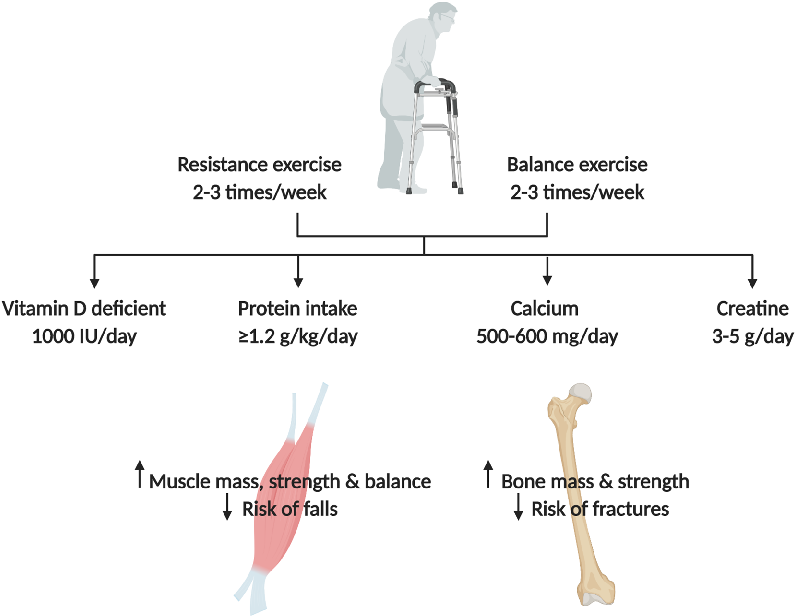
Outcome data from intervention studies targeting both bone and muscle health in osteosarcopenic patients are compared across different therapeutic approaches.
Osteosarcopenia: epidemiology, diagnosis, and treatment-facts and numbers.
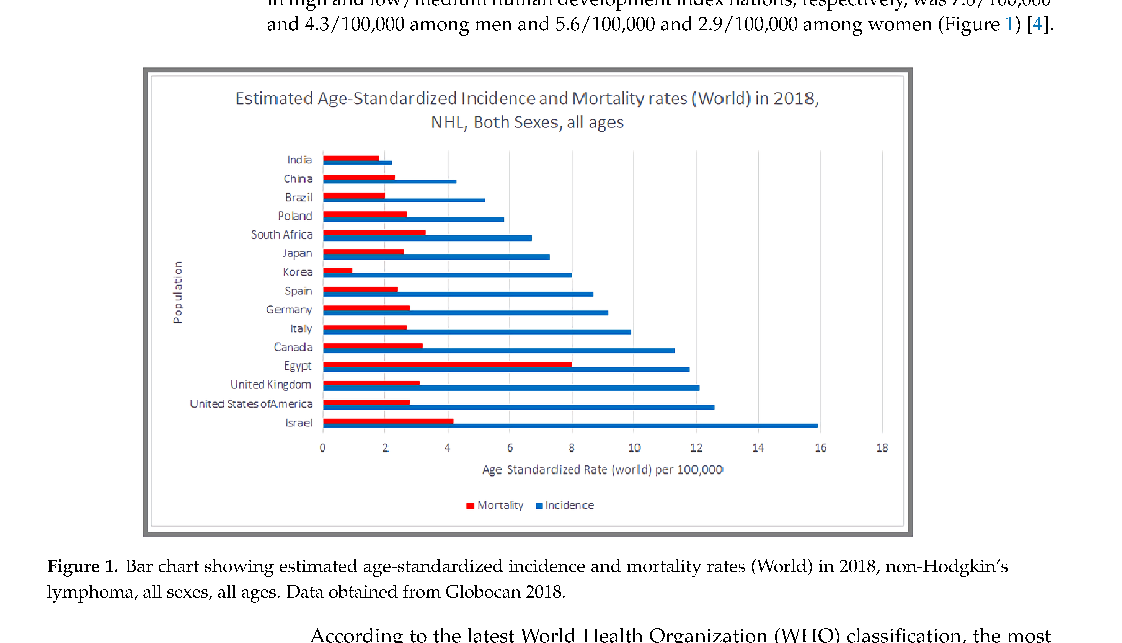
NHL mortality patterns reflect disparities in treatment access and disease subtype distribution. This figure presents survival and mortality data across different NHL classifications.
Epidemiology of Non-Hodgkin's Lymphoma.
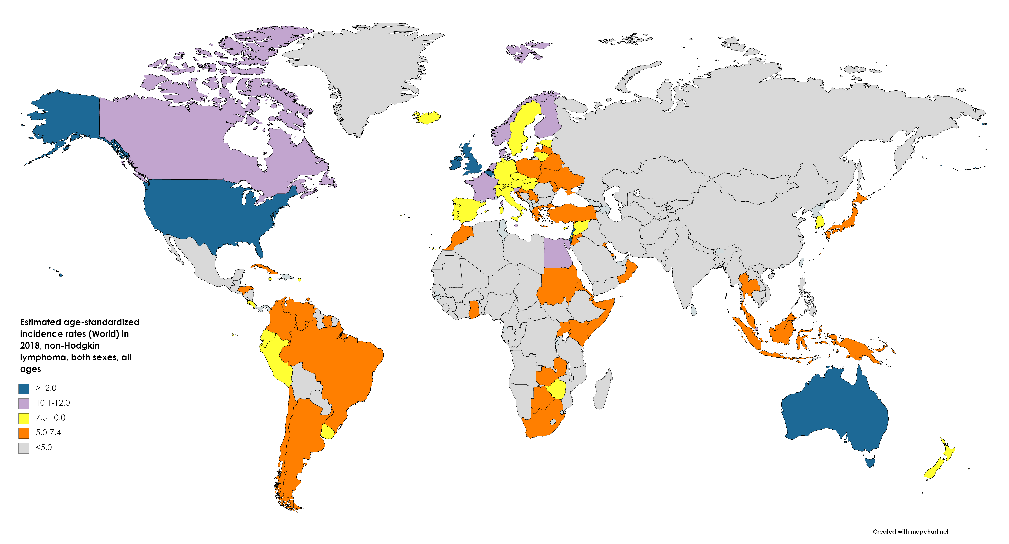
The epidemiological profile of Non-Hodgkin's lymphoma continues to evolve with improved molecular classification. This figure provides additional epidemiological data on NHL subtypes and their relative frequencies.
Epidemiology of Non-Hodgkin's Lymphoma.
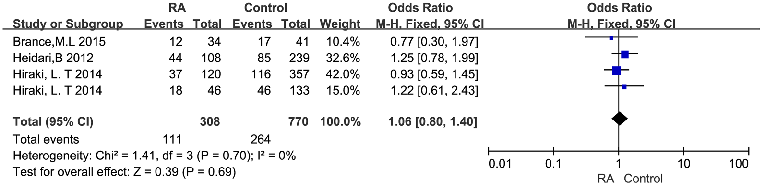
Geographic and seasonal variation in vitamin D status may confound the relationship with RA disease activity. This figure presents stratified analyses accounting for latitude, season, or supplementation status among RA patients.
Serum Vitamin D Level and Rheumatoid Arthritis Disease Activity: Review and Meta-Analysis.
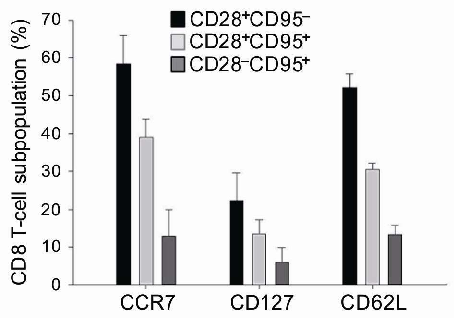
Correlation analysis between serum 25-hydroxyvitamin D levels and CD8 T cell subset distributions during early aging reveals that higher vitamin D is associated with decline of naive but accumulation of effector memory T cells.
Increased vitamin D is associated with decline of naïve, but accumulation of …
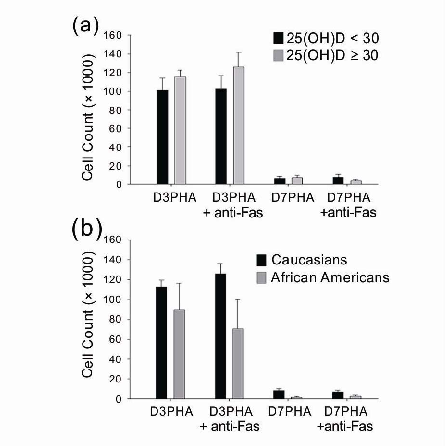
T cell proliferative responses and anti-Fas antibody-mediated suppression assays demonstrate that vitamin D status influences both proliferative capacity and apoptosis susceptibility of CD8 T cell subsets during aging.
Increased vitamin D is associated with decline of naïve, but accumulation of …
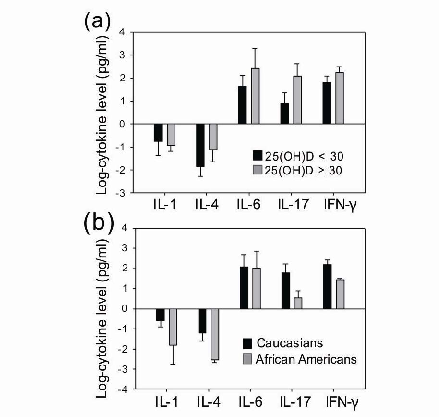
Cytokine levels (log-transformed) compared between 25(OH)D groups reveal differential inflammatory profiles associated with vitamin D status, with higher vitamin D linked to altered TNF-alpha and IFN-gamma production by CD8 T cells.
Increased vitamin D is associated with decline of naïve, but accumulation of …