Proses Penelitian
333 gambar dari penelitian yang ditinjau oleh rekan sejawat

Preclinical evidence supports cordycepin's hepatoprotective and nephroprotective properties. This figure presents data on cordycepin's organ-protective effects in various disease models.
Cordycepin for Health and Wellbeing: A Potent Bioactive Metabolite of an Entomopathogenic …
![Figure 4. (A) Possible mechanism of cordycepin for its anti-diabetic activity (B) Possible mechanism of cordycepin in regulation of fat metabolism in hyperlipidemia [47].](https://pdfs.citedhealth.com/figures/32545666/197.png)
Cordycepin may exert anti-diabetic effects through regulation of glucose metabolism and insulin sensitivity. Panel A illustrates the proposed mechanism for anti-diabetic activity, while Panel B depicts cordycepin's role in fat metabolism regulation in hyperlipidemia.
Cordycepin for Health and Wellbeing: A Potent Bioactive Metabolite of an Entomopathogenic …
![Figure 5. Expected global nutraceutical market by 2025 with China, India, Tibet and Nepal as global leaders for production and extraction of cordycepin [144].](https://pdfs.citedhealth.com/figures/32545666/223.png)
Global demand for Cordyceps-based nutraceuticals is concentrated in China, India, Tibet, and Nepal. This figure projects the expected nutraceutical market growth, with these regions positioned as global leaders in cordycepin production and extraction.
Cordycepin for Health and Wellbeing: A Potent Bioactive Metabolite of an Entomopathogenic …
![Figure 2. Chemical structure of the main xanthophylls present in algae [82].](https://pdfs.citedhealth.com/figures/33801636/327.png)
Marine algae produce several structurally distinct xanthophylls with unique bioactive profiles. This figure displays the chemical structures of the main xanthophylls present in algae, including fucoxanthin, astaxanthin, zeaxanthin, and lutein.
Xanthophylls from the Sea: Algae as Source of Bioactive Carotenoids.
Bioavailability and metabolism of dietary xanthophylls determine their physiological impact. This figure presents data on the absorption, distribution, and metabolic fate of algal carotenoids in biological systems.
Xanthophylls from the Sea: Algae as Source of Bioactive Carotenoids.
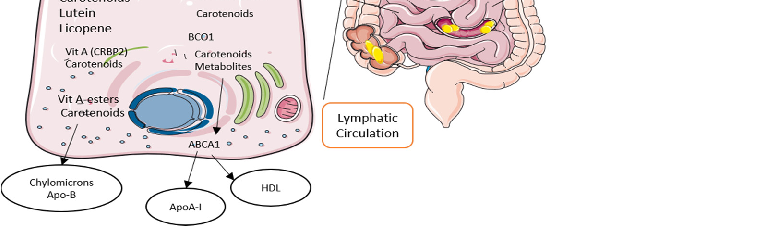
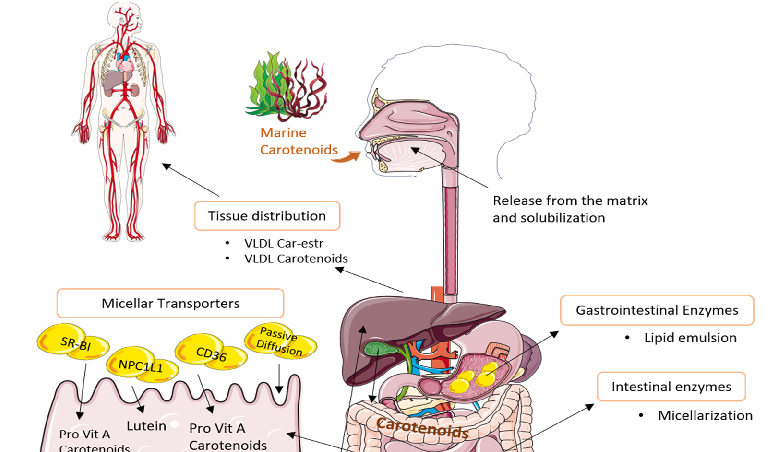
Marine carotenoids follow specific uptake, transport, and secretion pathways in the human body. This figure traces the journey of dietary xanthophylls from intestinal absorption through lymphatic transport to tissue distribution and hepatic metabolism.
Xanthophylls from the Sea: Algae as Source of Bioactive Carotenoids.
Heterogeneity among studies examining vitamin D and RA disease activity warranted sensitivity analyses. This figure presents results from leave-one-out or subgroup analyses to identify sources of between-study variation.
Serum Vitamin D Level and Rheumatoid Arthritis Disease Activity: Review and Meta-Analysis.
Inverse correlations between serum vitamin D levels and RA disease activity scores have been reported across multiple studies. This figure synthesizes the evidence on vitamin D deficiency as a potential modifiable risk factor in RA.
Serum Vitamin D Level and Rheumatoid Arthritis Disease Activity: Review and Meta-Analysis.
Geographic and seasonal variation in vitamin D status may confound the relationship with RA disease activity. This figure presents stratified analyses accounting for latitude, season, or supplementation status among RA patients.
Serum Vitamin D Level and Rheumatoid Arthritis Disease Activity: Review and Meta-Analysis.
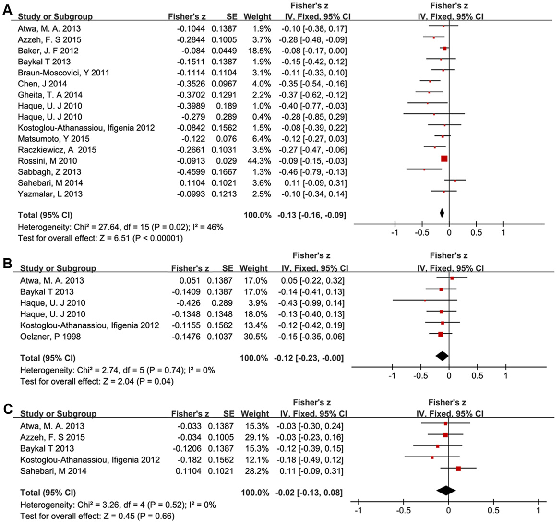
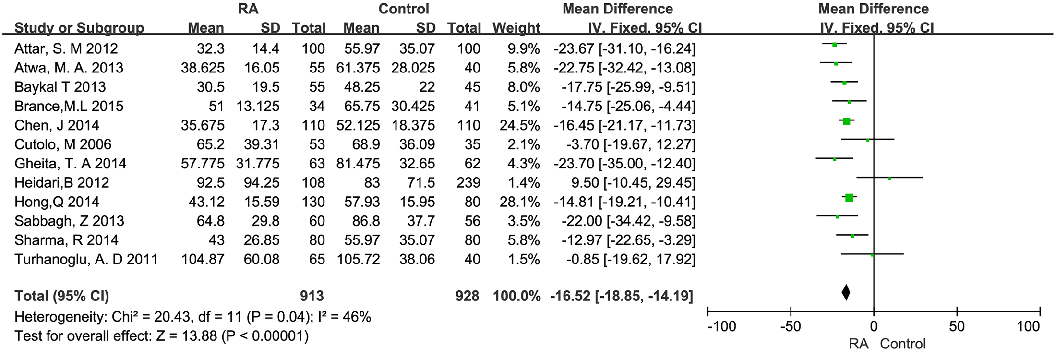
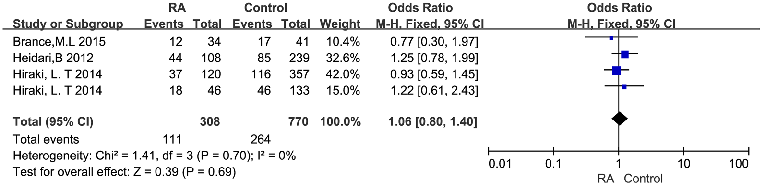
Forest plots display the relationship between serum vitamin D levels and disease activity in RA patients. Summary Fisher's z tests with 95% confidence intervals show associations between vitamin D and DAS28 scores across multiple studies.
Serum Vitamin D Level and Rheumatoid Arthritis Disease Activity: Review and Meta-Analysis.
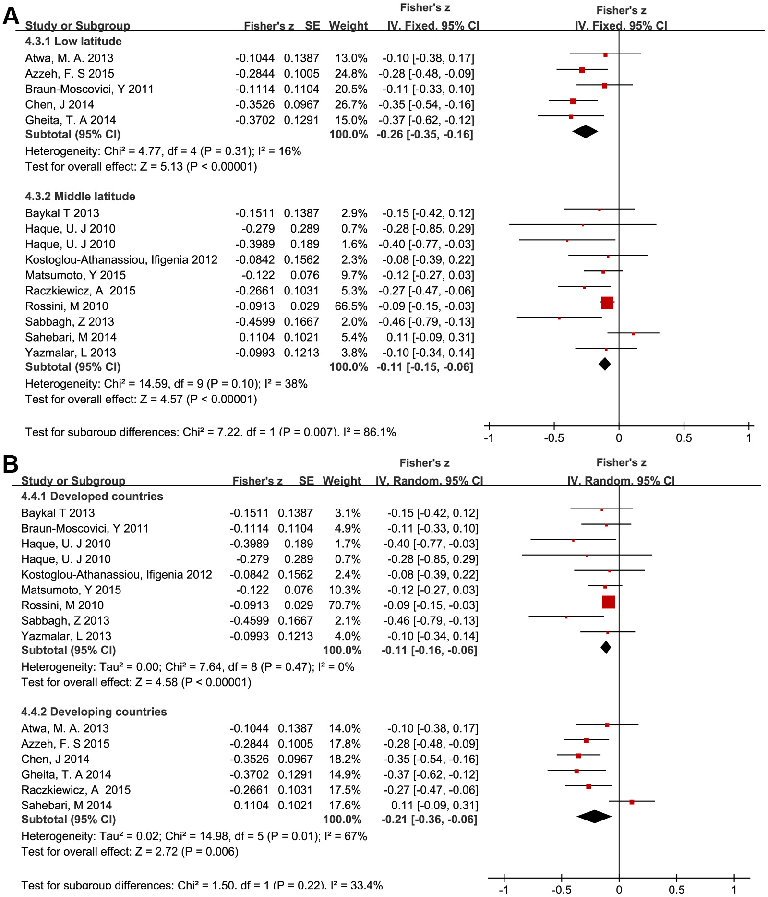
Subgroup analysis forest plots examine the vitamin D-disease activity relationship in RA patients stratified by study characteristics. Fisher's z scores with 95% confidence intervals indicate consistent inverse associations across subgroups.
Serum Vitamin D Level and Rheumatoid Arthritis Disease Activity: Review and Meta-Analysis.
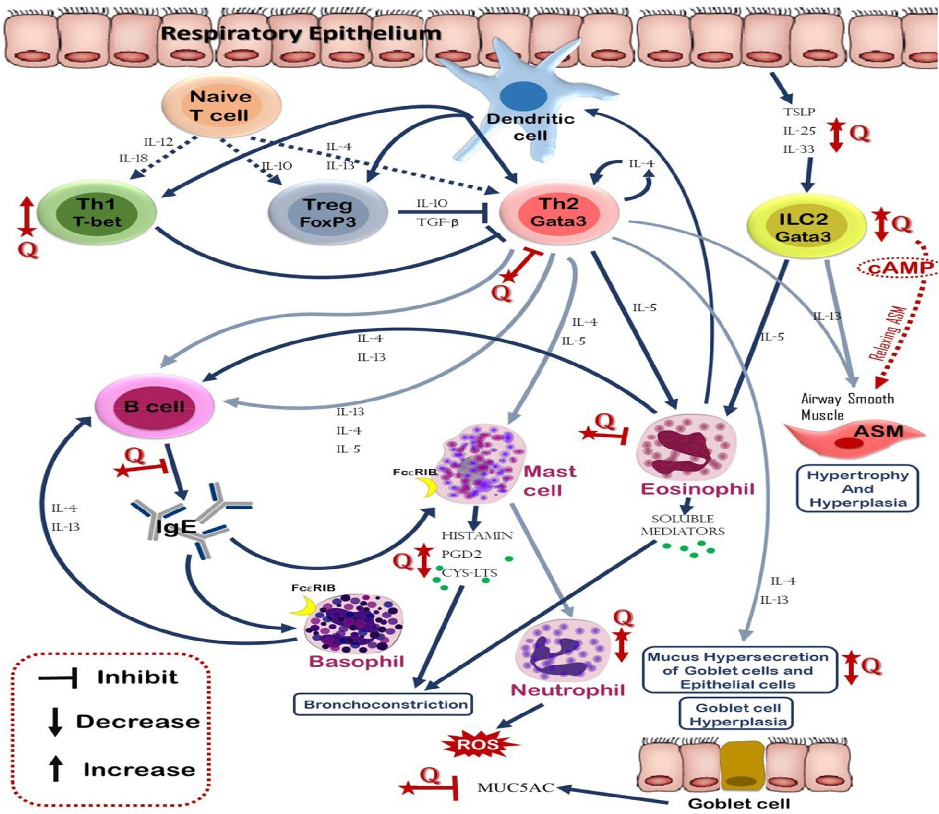
Quercetin exerts multiple effects on immune cells involved in asthma pathogenesis. This diagram maps quercetin's influence on eosinophils, mast cells, T-cells, and airway epithelial cells, highlighting its potential as a multi-target anti-asthmatic agent.
Quercetin with the potential effect on allergic diseases.
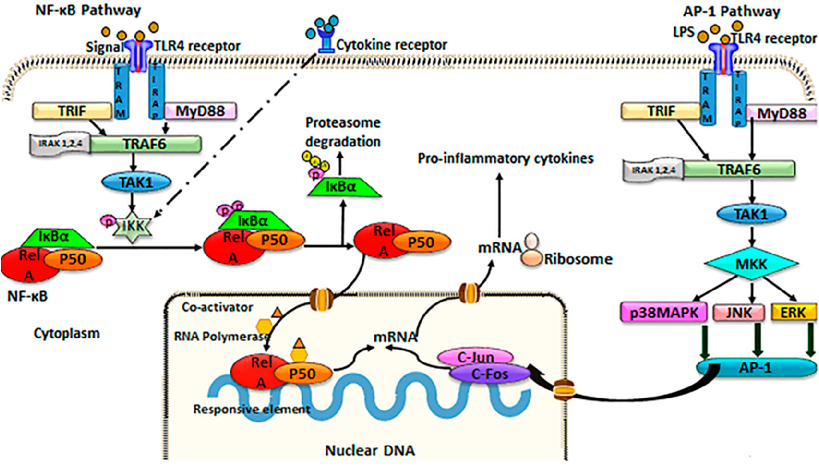
TLR4/NF-kB/AP-1 signaling is a key inflammatory pathway in intestinal disease. This schematic illustrates the cascade from TLR4 receptor activation through NF-kB and AP-1 transcription factors to pro-inflammatory gene expression, and indicates where curcumin may intervene.
Curcumin and Intestinal Inflammatory Diseases: Molecular Mechanisms of Protection.
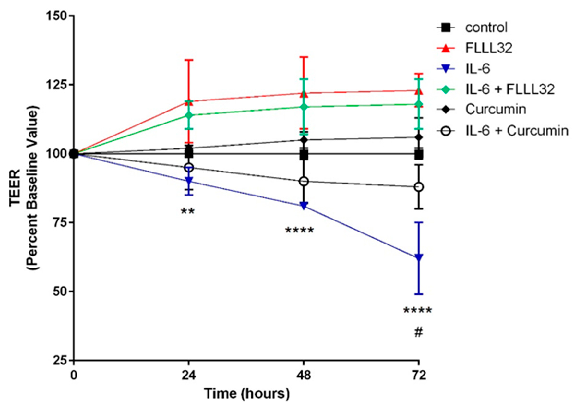
FLLL32 (a curcumin analogue) and curcumin both protect against IL-6-induced reduction of transepithelial electrical resistance (TEER) in T84 cell monolayers. This graph shows that curcumin preserves intestinal barrier integrity by counteracting cytokine-mediated tight junction disruption over 72 hours.
Curcumin and Intestinal Inflammatory Diseases: Molecular Mechanisms of Protection.
Curcumin's effects on intestinal tight junction proteins have been demonstrated in multiple experimental models. This figure presents protein expression or immunofluorescence data showing curcumin-mediated preservation of barrier function.
Curcumin and Intestinal Inflammatory Diseases: Molecular Mechanisms of Protection.
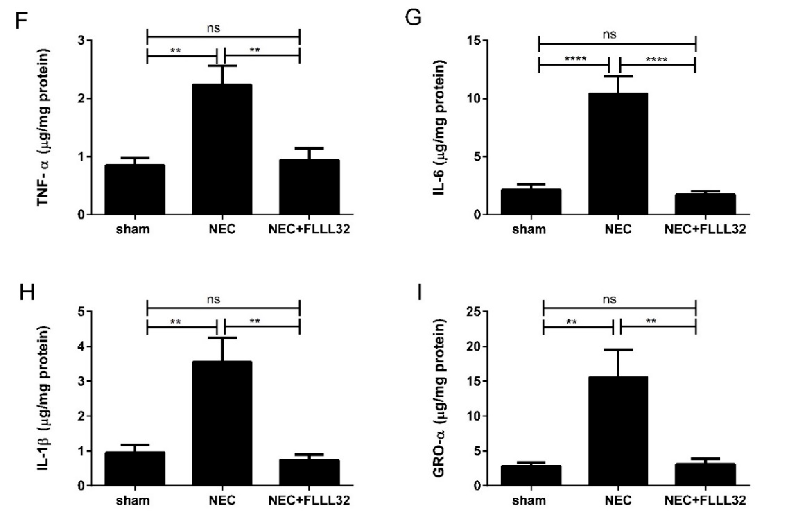
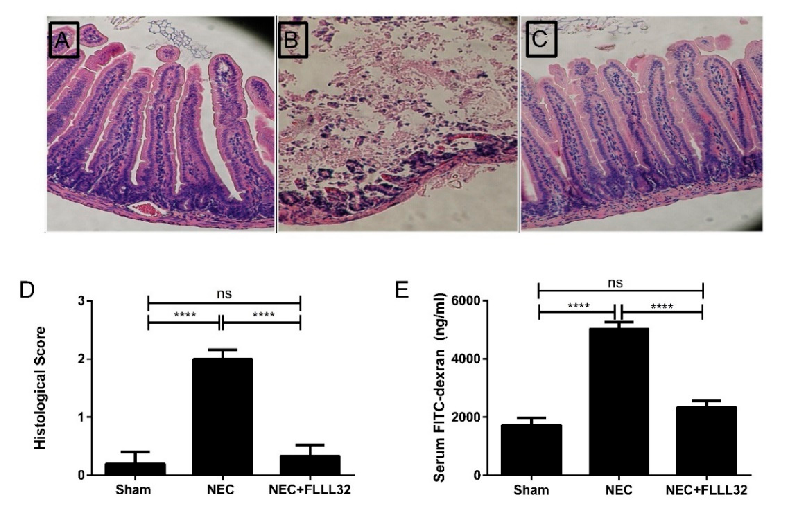
Animal models of necrotizing enterocolitis and colitis respond favorably to curcumin treatment. This figure presents in vivo data on curcumin's protective effects in experimental intestinal inflammation.
Curcumin and Intestinal Inflammatory Diseases: Molecular Mechanisms of Protection.
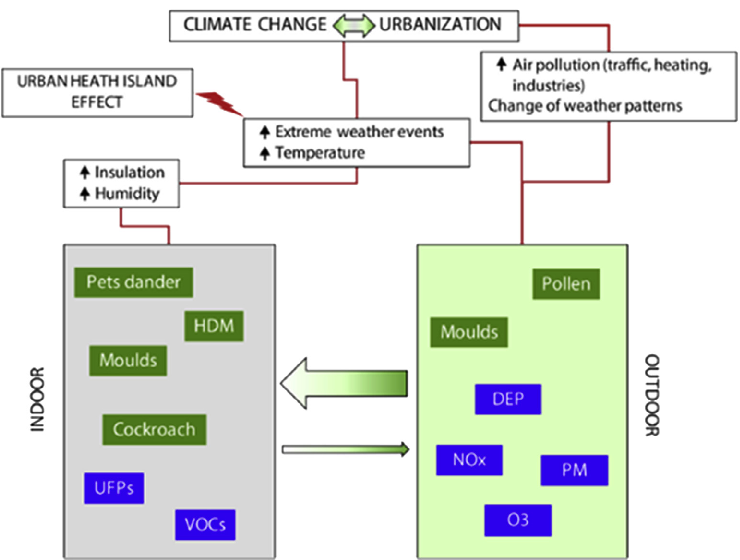
Diesel exhaust particles, nitrogen oxides, particulate matter, ground-level ozone, and volatile organic compounds interact with allergens to worsen allergic rhinitis. This figure maps how these pollutants enhance house dust mite sensitization and modulate allergic airway responses.
International expert consensus on the management of allergic rhinitis (AR) aggravated by …

Expert consensus recommendations address the clinical management of allergic rhinitis aggravated by air pollution. This figure summarizes therapeutic strategies including pharmacological interventions and environmental exposure reduction.
International expert consensus on the management of allergic rhinitis (AR) aggravated by …
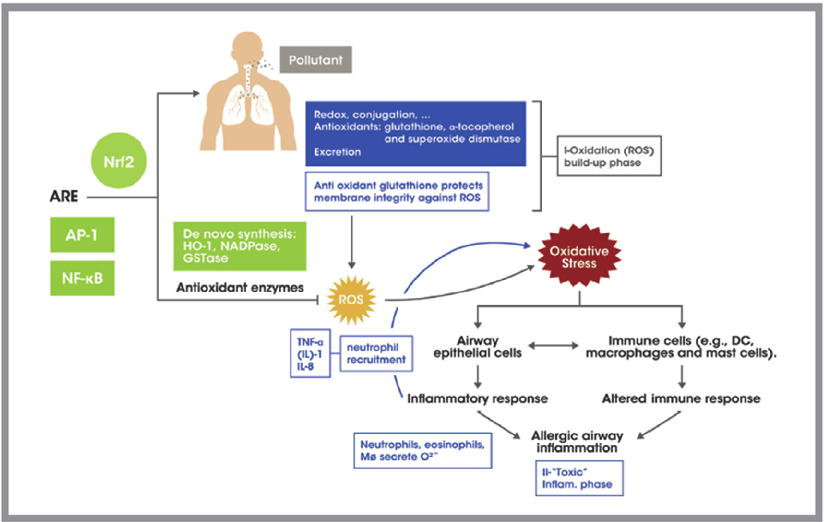
Air pollutants generate oxidative stress in the airway, driving allergic inflammation through the Nrf2 antioxidant response element pathway. This diagram illustrates how pollutant-induced reactive oxygen species activate the oxidative stress cascade, contributing to allergic airway disease.
International expert consensus on the management of allergic rhinitis (AR) aggravated by …
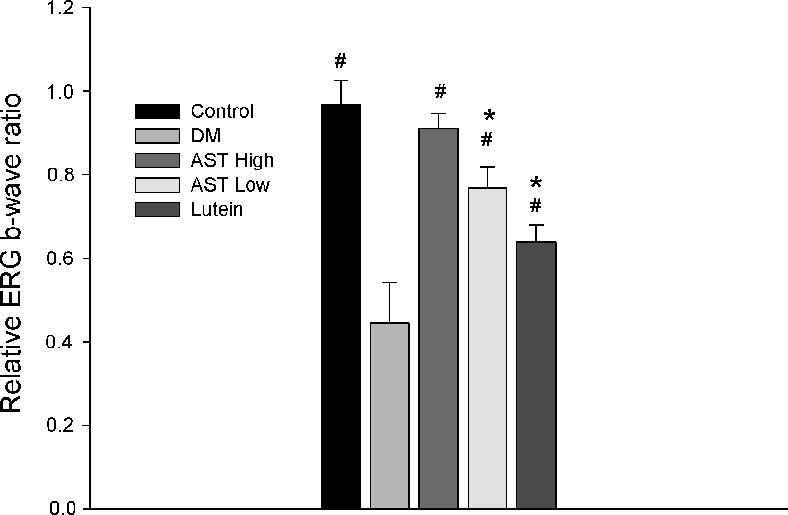
Electroretinography (ERG) recordings evaluating retinal function in control and STZ-induced diabetic rats treated with normal saline, 0.6 mg/kg AST, 3 mg/kg AST, or 0.5 mg/kg lutein for 8 weeks. ERG wave amplitudes indicate the functional impact of each treatment on diabetic retinal physiology.
Astaxanthin Inhibits Expression of Retinal Oxidative Stress and Inflammatory Mediators in Streptozotocin-Induced …
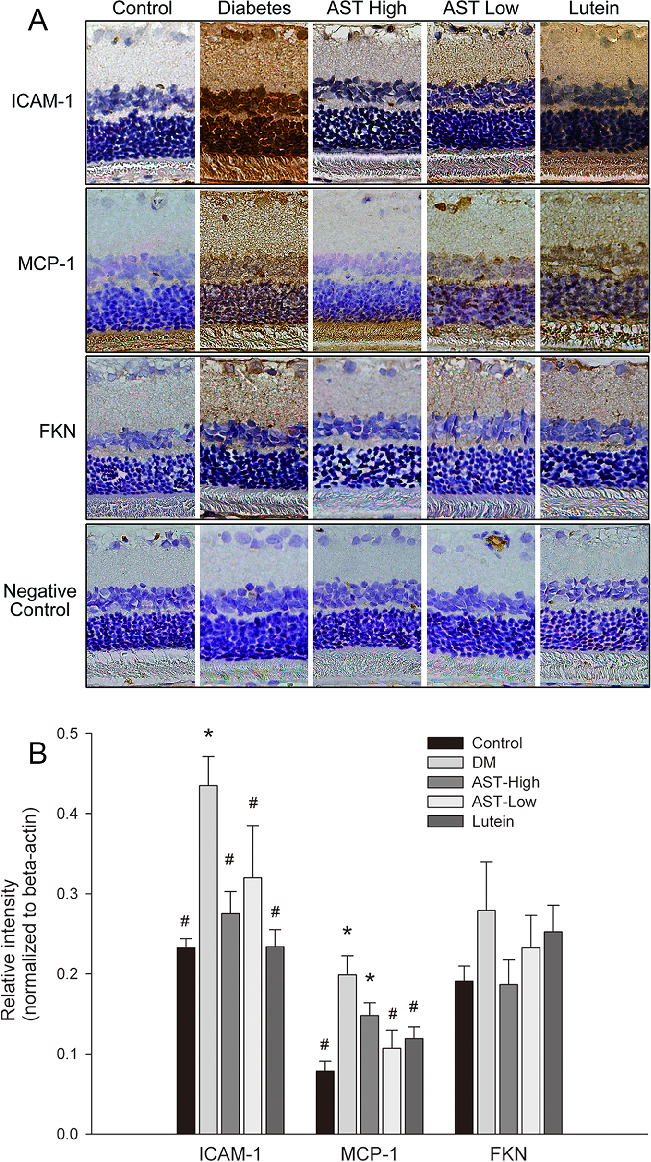
Inflammatory marker expression levels in retinal tissue or aqueous humor of diabetic rats, comparing astaxanthin-treated groups with untreated diabetic controls. Results indicate AST may modulate inflammatory mediator production.
Astaxanthin Inhibits Expression of Retinal Oxidative Stress and Inflammatory Mediators in Streptozotocin-Induced …
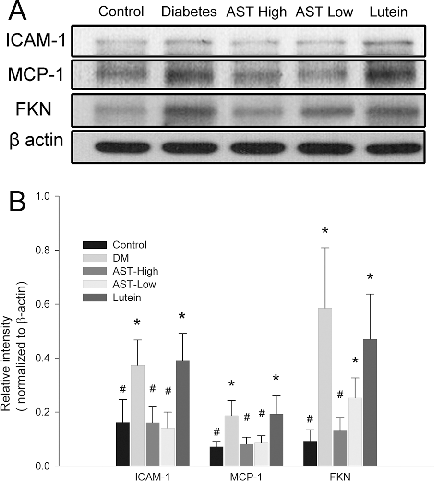
Western blot or protein expression analysis of retinal inflammatory and oxidative stress markers in the diabetic rat model, demonstrating the molecular effects of astaxanthin treatment on key signaling proteins.
Astaxanthin Inhibits Expression of Retinal Oxidative Stress and Inflammatory Mediators in Streptozotocin-Induced …
Gene or protein expression data for retinal vascular endothelial growth factor (VEGF) or related angiogenic markers in AST-treated versus untreated diabetic rats.
Astaxanthin Inhibits Expression of Retinal Oxidative Stress and Inflammatory Mediators in Streptozotocin-Induced …
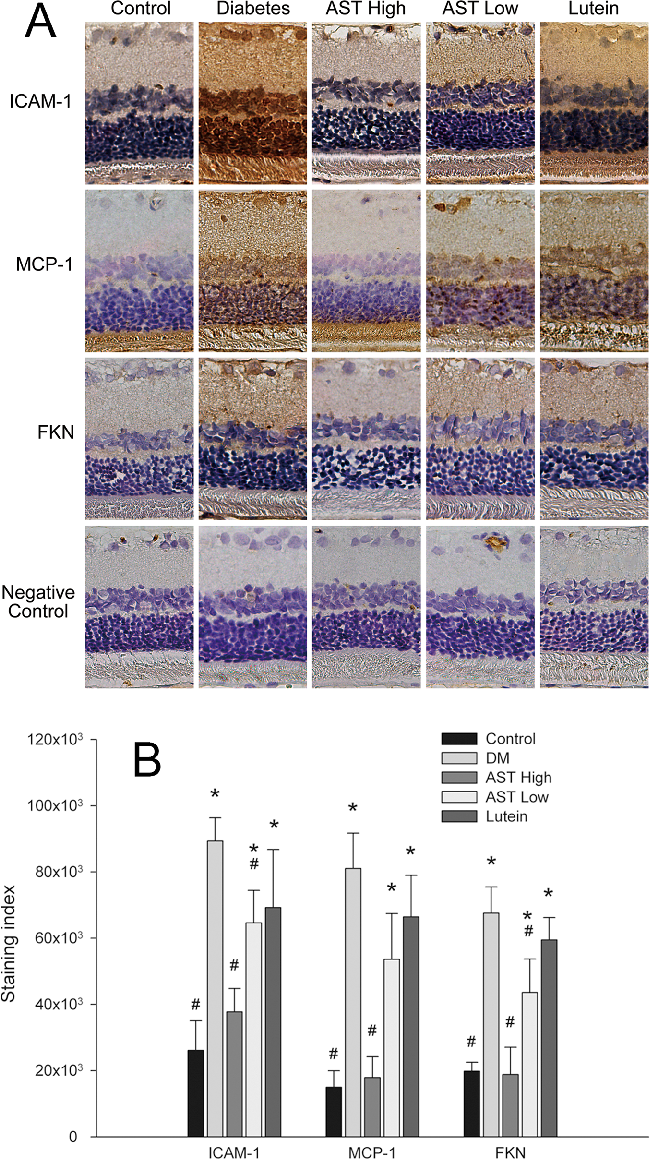
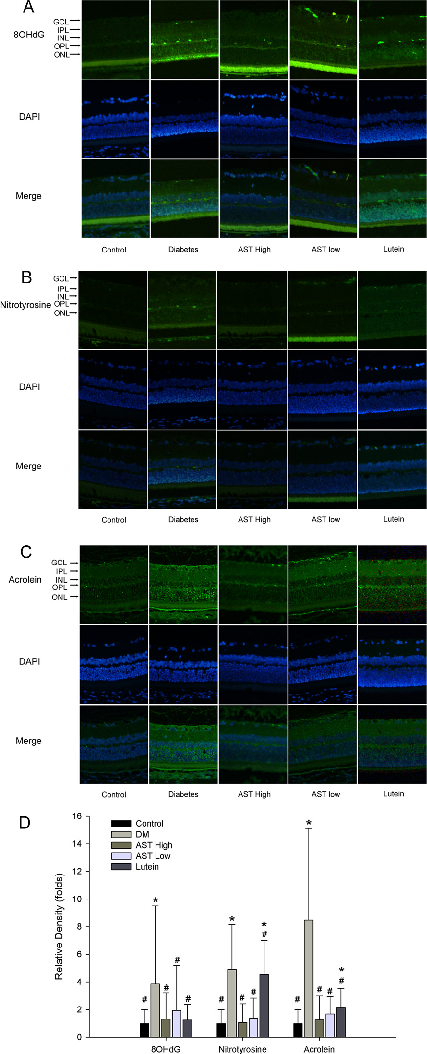
Histological or immunohistochemical analysis of retinal tissue sections from diabetic rats, comparing structural changes across treatment groups to assess astaxanthin's protective effects on retinal architecture.
Astaxanthin Inhibits Expression of Retinal Oxidative Stress and Inflammatory Mediators in Streptozotocin-Induced …
Halaman 3 dari 14