Vitamin D Figuras
5 figuras de pesquisa revisada por pares
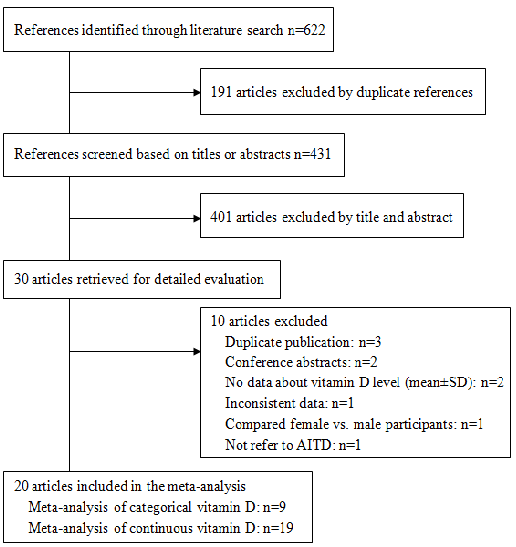
Meta-analysis results indicate that vitamin D deficiency is significantly more prevalent among patients with autoimmune thyroid disease compared to healthy controls. Lower serum 25-hydroxyvitamin D levels are associated with increased odds of both Hashimoto's thyroiditis and Graves' disease.
Meta-analysis of the association between vitamin D and autoimmune thyroid disease.
Heterogeneity among studies examining vitamin D and RA disease activity warranted sensitivity analyses. This figure presents results from leave-one-out or subgroup analyses to identify sources of between-study variation.
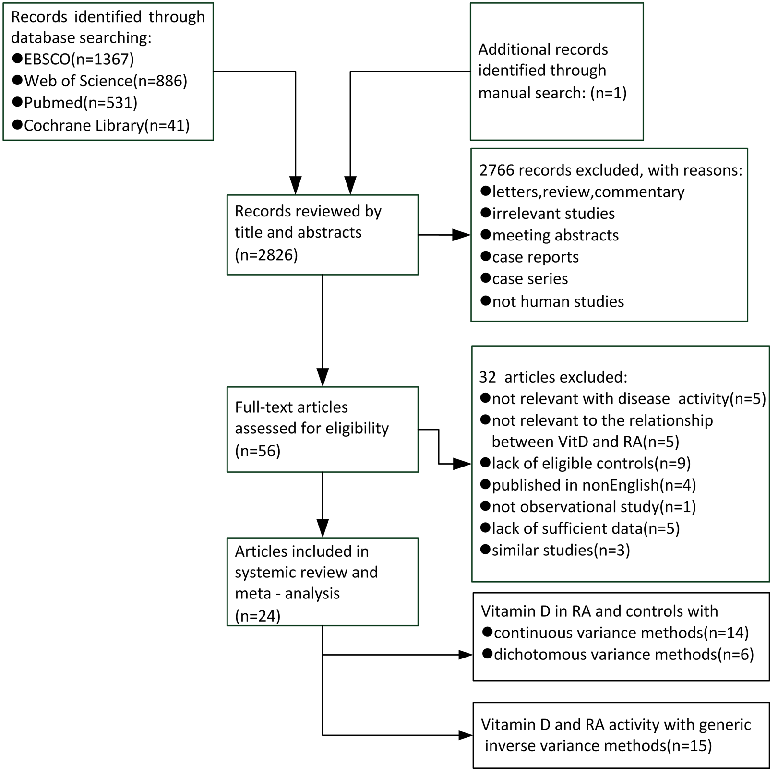
Serum Vitamin D Level and Rheumatoid Arthritis Disease Activity: Review and Meta-Analysis.
Inverse correlations between serum vitamin D levels and RA disease activity scores have been reported across multiple studies. This figure synthesizes the evidence on vitamin D deficiency as a potential modifiable risk factor in RA.
Serum Vitamin D Level and Rheumatoid Arthritis Disease Activity: Review and Meta-Analysis.
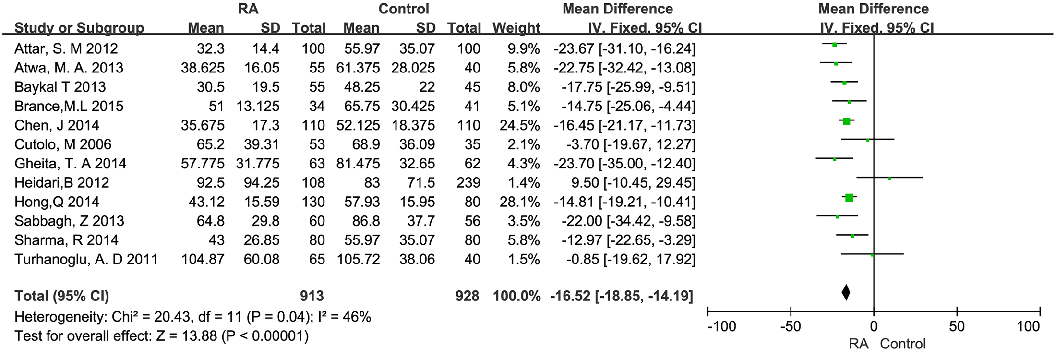
Forest plots display the relationship between serum vitamin D levels and disease activity in RA patients. Summary Fisher's z tests with 95% confidence intervals show associations between vitamin D and DAS28 scores across multiple studies.
Serum Vitamin D Level and Rheumatoid Arthritis Disease Activity: Review and Meta-Analysis.
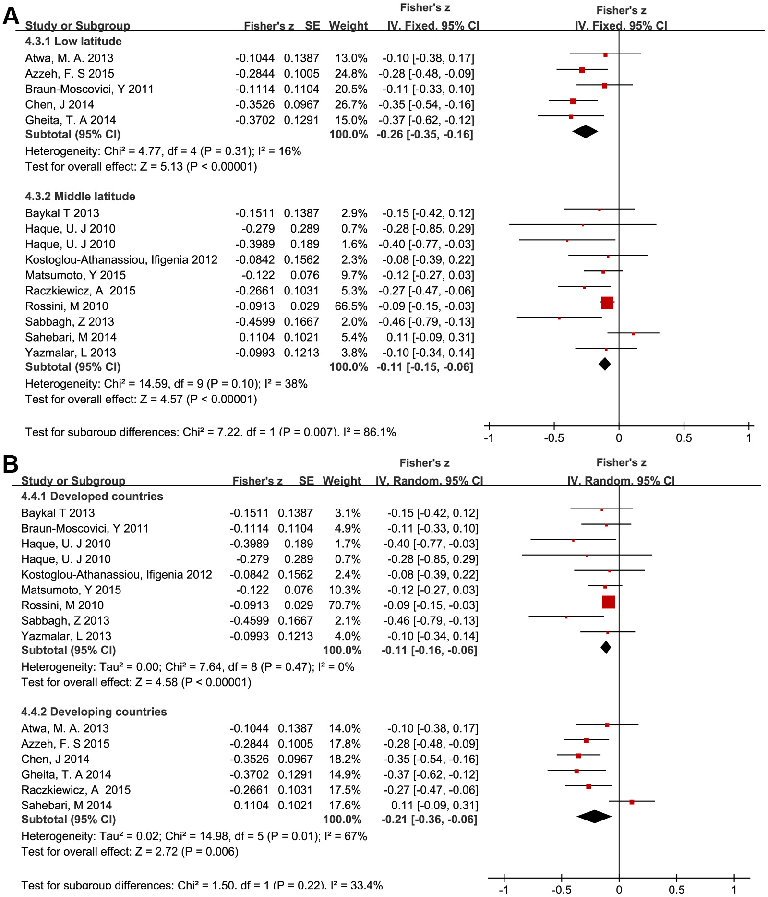
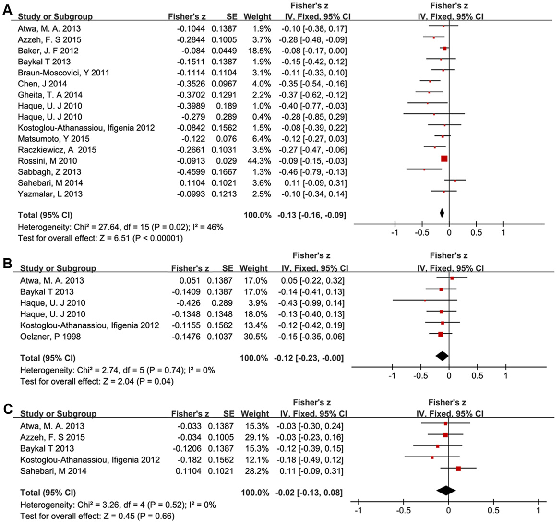
Subgroup analysis forest plots examine the vitamin D-disease activity relationship in RA patients stratified by study characteristics. Fisher's z scores with 95% confidence intervals indicate consistent inverse associations across subgroups.
Serum Vitamin D Level and Rheumatoid Arthritis Disease Activity: Review and Meta-Analysis.