अनुसंधान प्रक्रिया
333 सहकर्मी-समीक्षित शोध से आंकड़े
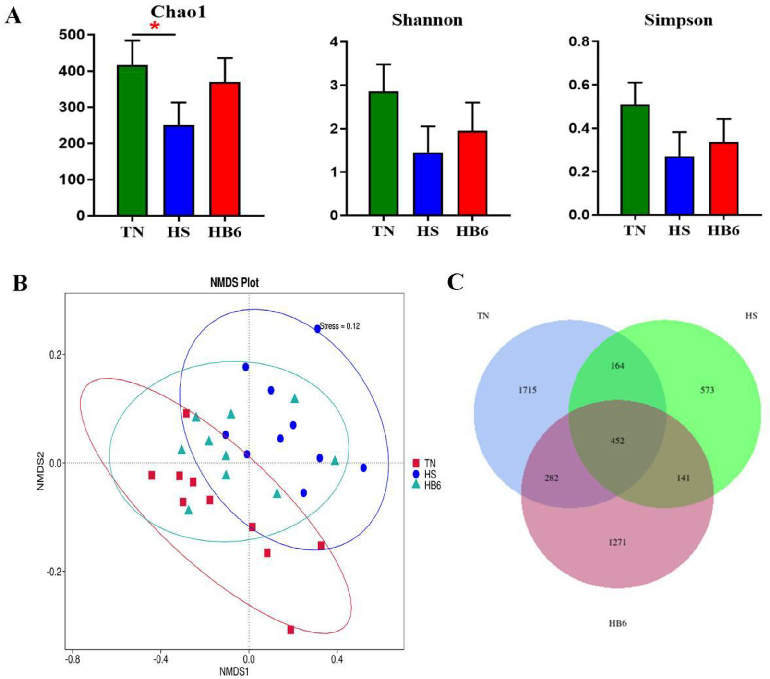
Figure 4. Effect of vitamin B6 on the composition of gut microbiota in the ileum mucosa of heat-stressed broilers. (A) a diversity indices (Chao1, Shannon, Simpson). (B) Non-metric multidimensional scaling …
Dietary vitamin B6 supplementation alleviates heat stress-induced intestinal barrier impairment by regulating …
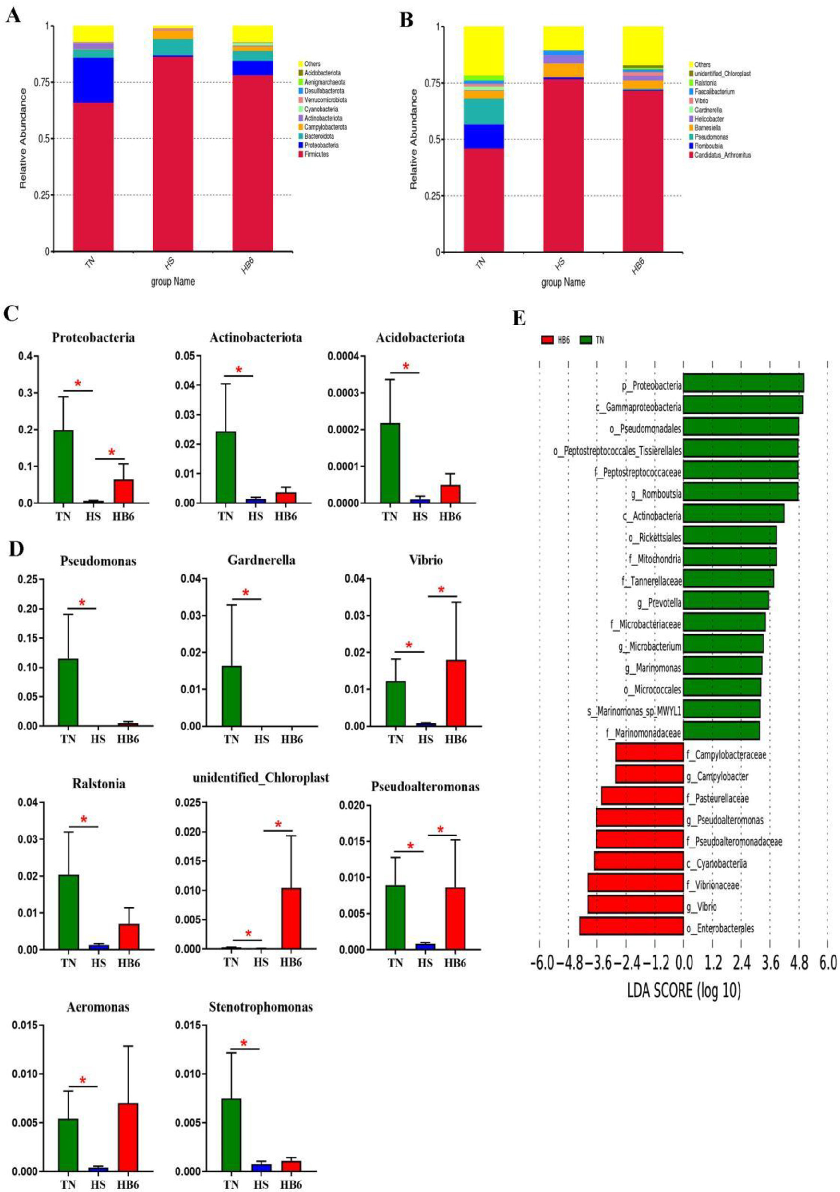
Figure 5. Differences in the bacterial communities of ileum mucosa determined by LEfSe analysis and MetaStat analysis. (A) The microbial community at the phylum level. (B) The microbial community at …
Dietary vitamin B6 supplementation alleviates heat stress-induced intestinal barrier impairment by regulating …
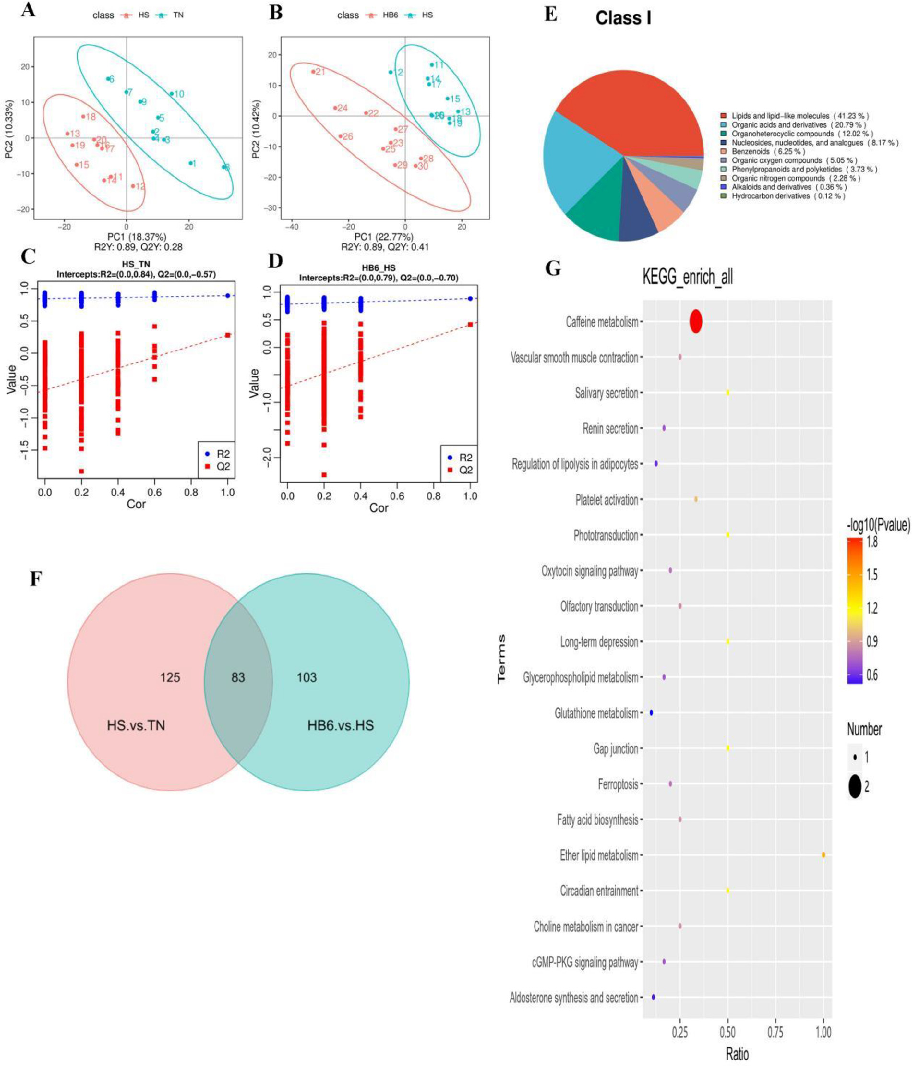
Figure 6. Effect of vitamin B6 on the ileum mucosa metabolites of heat-stressed broilers. (A-B) Partial least squares-discriminant analysis (PLS-DA) score plot. (C-D) PLS-DA valid plot. (E) Pie chart of …
Dietary vitamin B6 supplementation alleviates heat stress-induced intestinal barrier impairment by regulating …
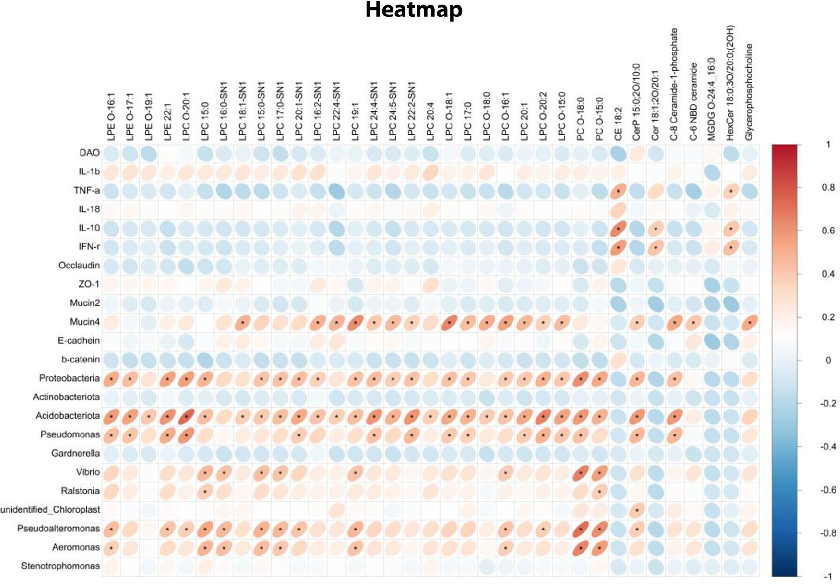
Figure 7. Spearman correlation among ileal differential metabolites with FC > 2, differential microbiota at the phylum and genus levels, differential gut barrier parameters and inflammatory cytokines. The red circle …
Dietary vitamin B6 supplementation alleviates heat stress-induced intestinal barrier impairment by regulating …
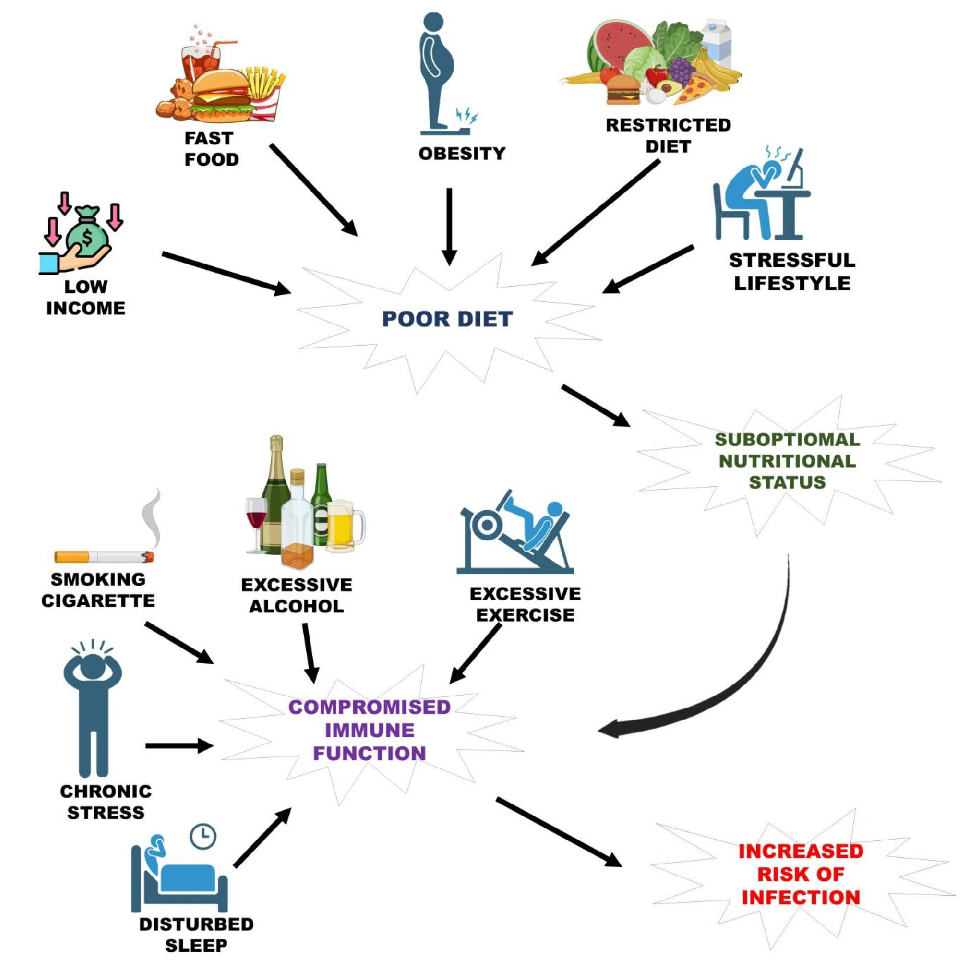
Micro nutrients as immunomodulators in the ageing population: a focus on inflammation …
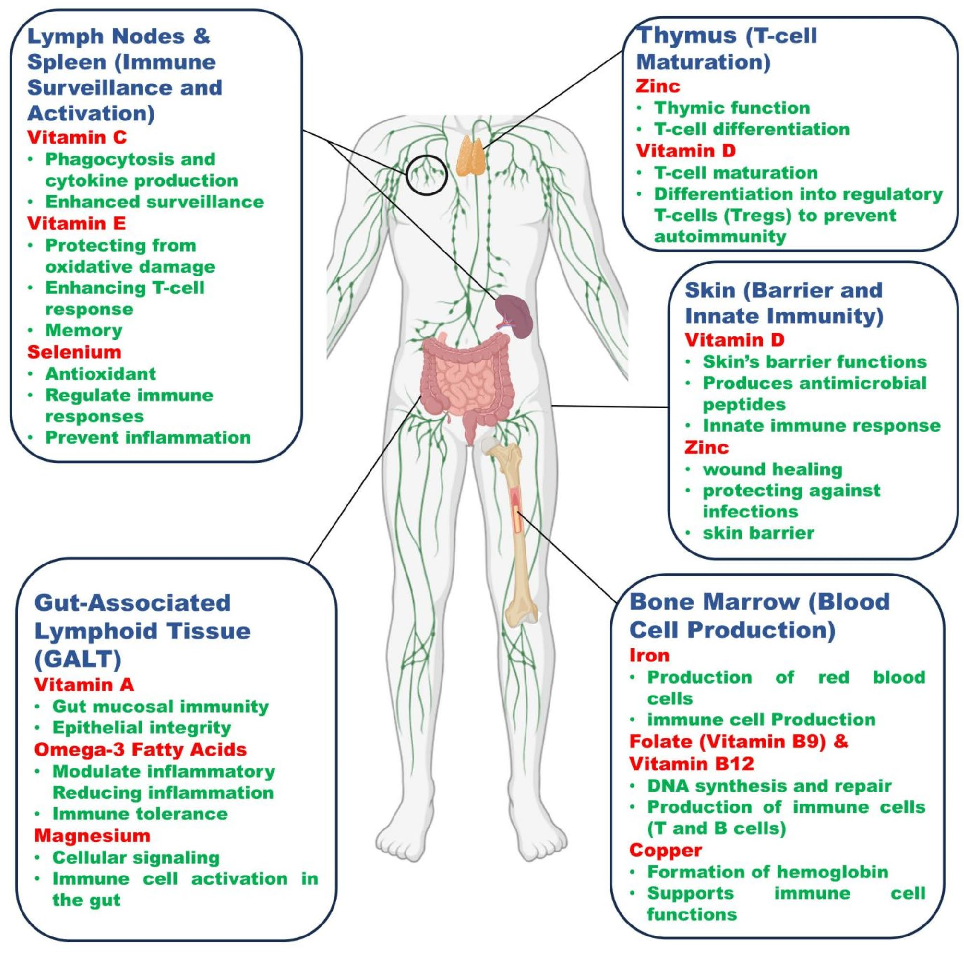
Micro nutrients as immunomodulators in the ageing population: a focus on inflammation …
Micro nutrients as immunomodulators in the ageing population: a focus on inflammation …
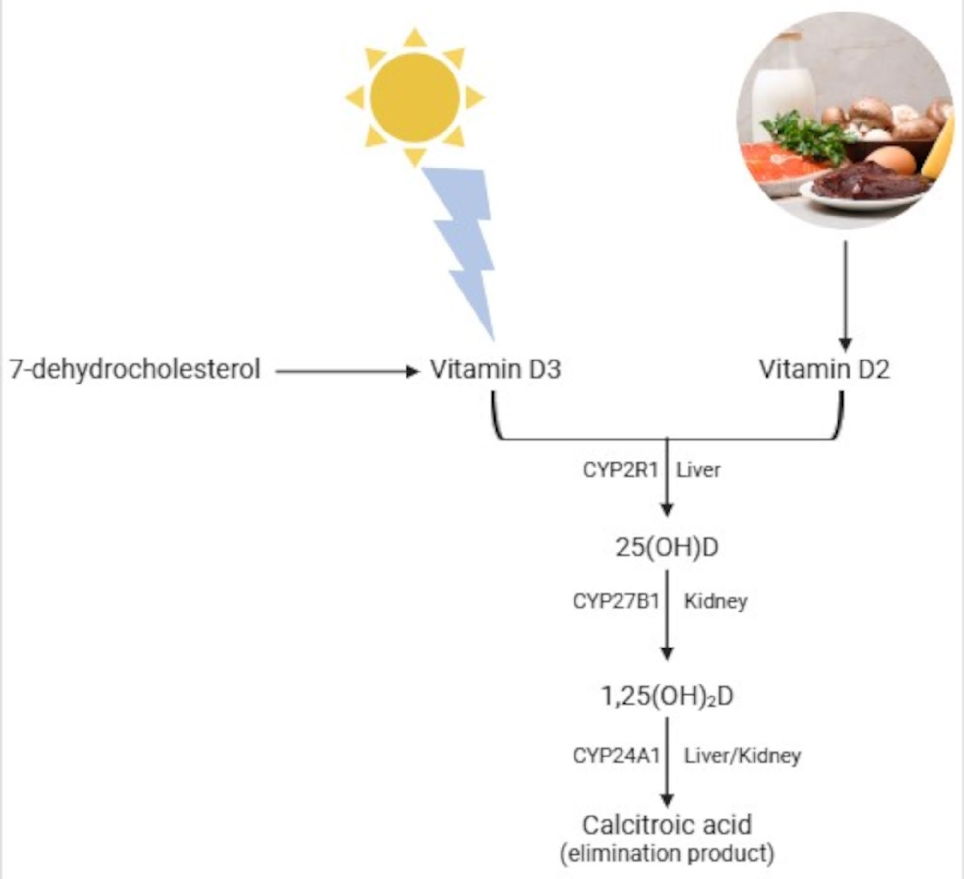
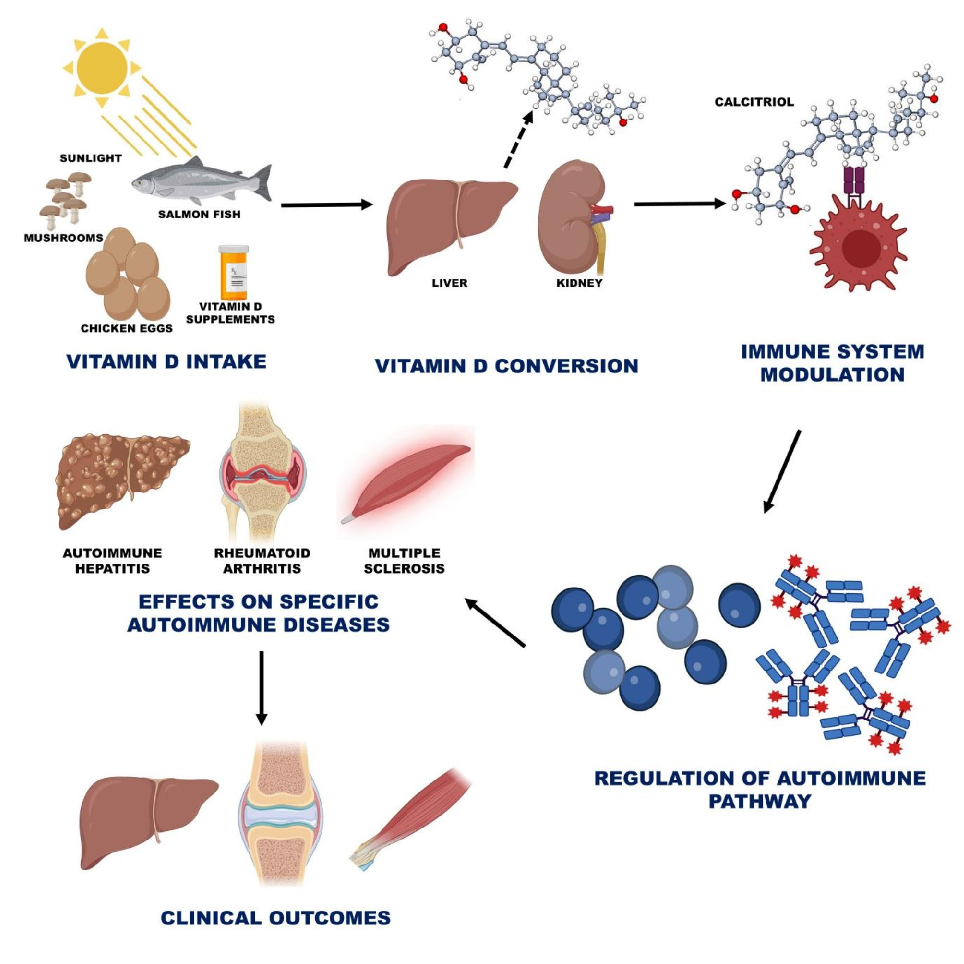
Gut-vitamin D interplay: key to mitigating immunosenescence and promoting healthy ageing.
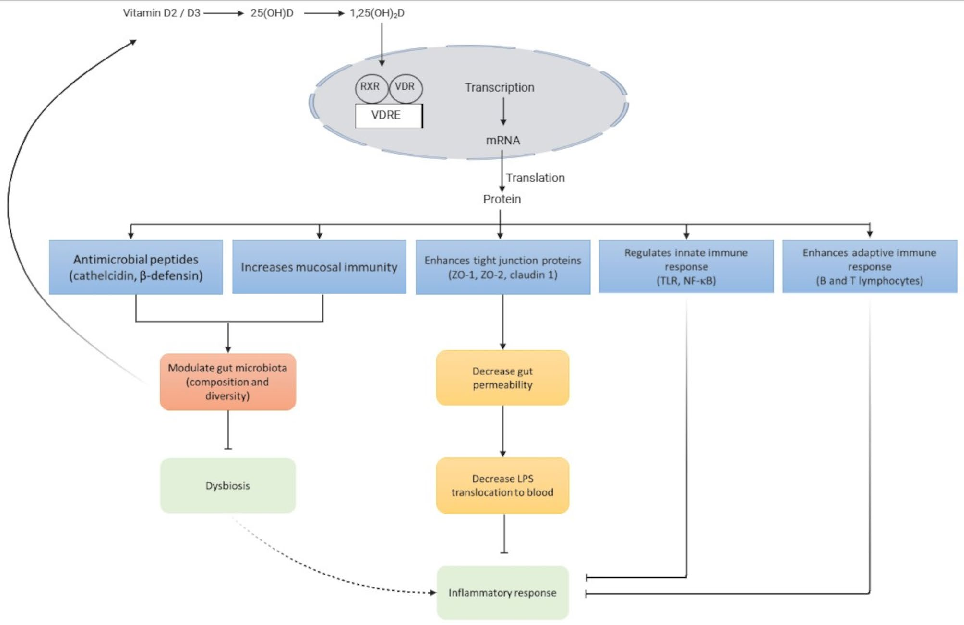
Gut-vitamin D interplay: key to mitigating immunosenescence and promoting healthy ageing.
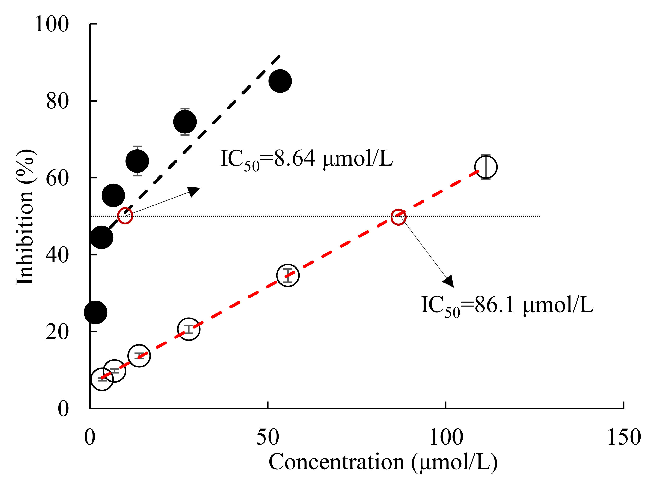
Experimental results examining simultaneous Inhibitory Effects of All, with data points illustrating key findings related to alzheimer´s disease is a global neurodegenerative health concern.
Simultaneous Inhibitory Effects of All-Trans Astaxanthin on Acetylcholinesterase and Oxidative Stress.
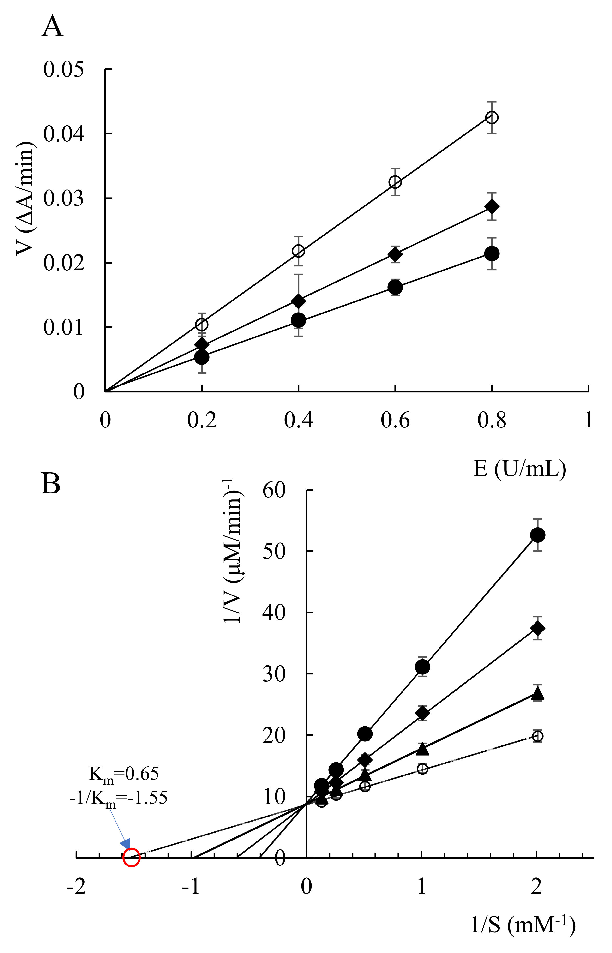
Reaction rates of acetylcholinesterase in the presence of all-trans astaxanthin with different concentrations (A), and Lineweaver–Burk reciprocal plots (B). ○: all-trans astaxanthin concentration 0 μmol/L; ▲: all-trans astaxanthin concentration 6.5 μmol/L; ◆: all-trans astaxanthin concentration 26 μmol/L; ●: all-trans astaxanthin concentration 5...
Simultaneous Inhibitory Effects of All-Trans Astaxanthin on Acetylcholinesterase and Oxidative Stress.
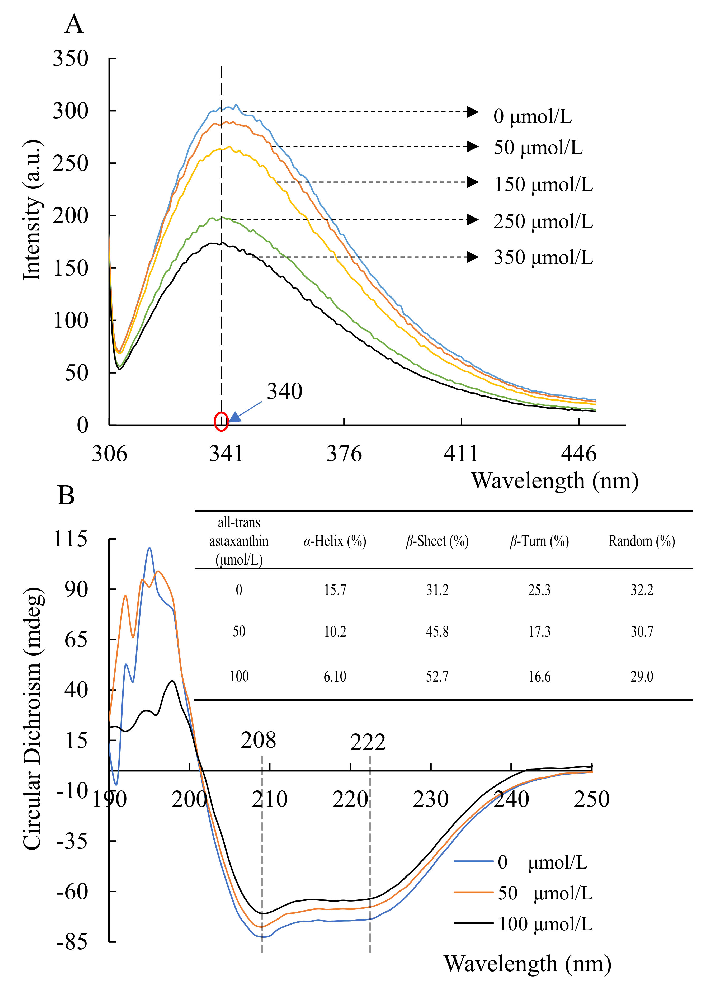
Fluorescence emission (A) and circular dichroism (B) spectra of acetylcholinesterase in the presence of all-trans astaxanthin with various concentrations.
Simultaneous Inhibitory Effects of All-Trans Astaxanthin on Acetylcholinesterase and Oxidative Stress.
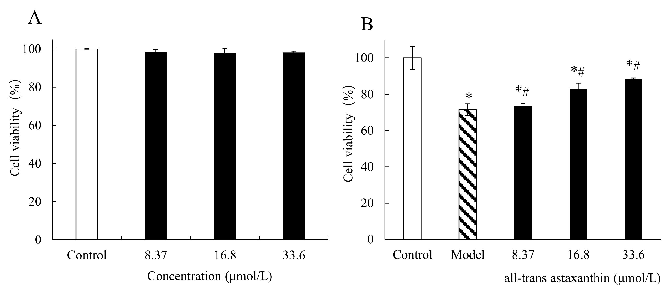
The effect of all-trans astaxanthin concentrations on cell viability in group (A) and in group (B) treated with Aβ25–35. : Control group; : astaxanthin-treatment group;
Simultaneous Inhibitory Effects of All-Trans Astaxanthin on Acetylcholinesterase and Oxidative Stress.
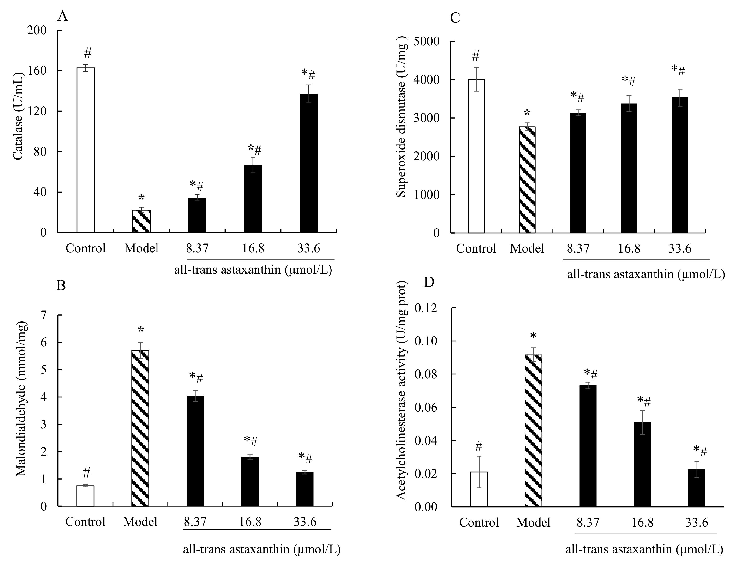
Effect of all-trans astaxanthin on intracellular antioxidant capacity and acetylcholinesterase activity. The levels of catalase (A), malondialdehyde (B), superoxide dismutase (C), and acetylcholinesterase activity (D) are shown.
Simultaneous Inhibitory Effects of All-Trans Astaxanthin on Acetylcholinesterase and Oxidative Stress.
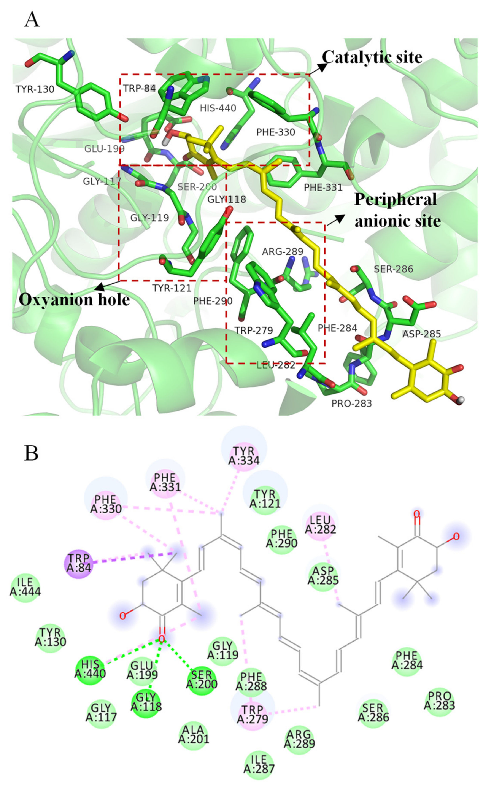
3D (A) and 2D (B) structural simulation of all-trans astaxanthin interacting with acetylcholinesterase.
Simultaneous Inhibitory Effects of All-Trans Astaxanthin on Acetylcholinesterase and Oxidative Stress.
Visual summary of the pathways and interactions relevant to the Effects of Astaxanthin on Cognitive Function and Neurodegeneration in Humans, as discussed in the context of oxidative stress is a key contributing factor in neurodegeneration, cognitive ageing, cognitive decline, and diminish.
The Effects of Astaxanthin on Cognitive Function and Neurodegeneration in Humans: A …
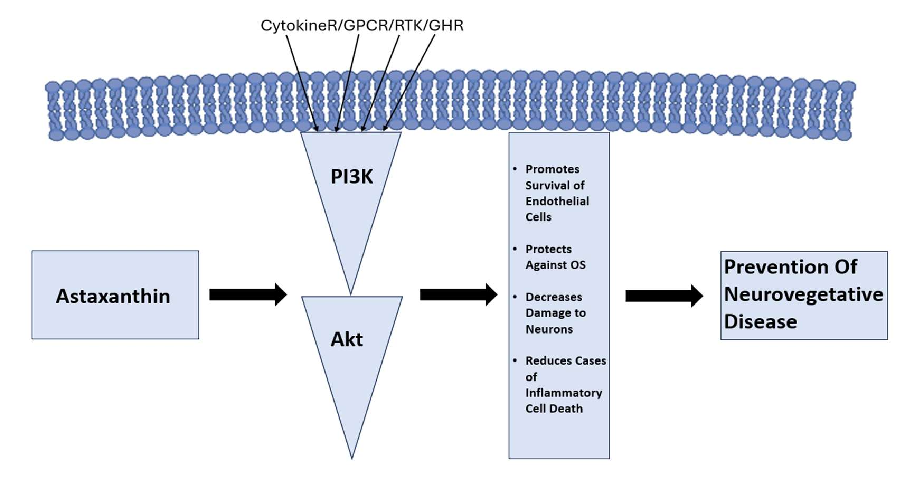
Schematic representation highlighting the mechanisms underlying the Effects of Astaxanthin on Cognitive Function and Neurodegeneration in Humans and their potential therapeutic implications.
The Effects of Astaxanthin on Cognitive Function and Neurodegeneration in Humans: A …
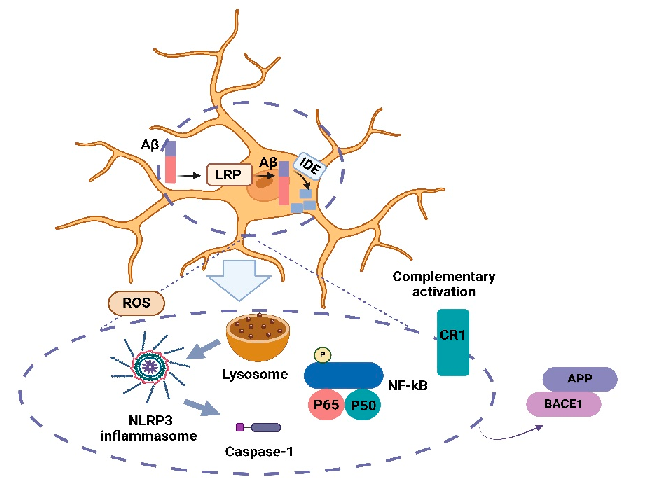
Brain microglia activation in AD. Microglia are effective in Aβ clearance, neuroinflammation, and the production and aggregation of Aβ.
Mechanisms Linking Obesity, Insulin Resistance, and Alzheimer's Disease: Effects of Polyphenols and …
Visual summary of the pathways and interactions relevant to mechanisms Linking Obesity, Insulin Resistance, and Alzheimer's Disease, as discussed in the context of alzheimer's disease (AD) is a complex neurodegenerative disorder characterized by progressive cognitive decline, memo.
Mechanisms Linking Obesity, Insulin Resistance, and Alzheimer's Disease: Effects of Polyphenols and …
Schematic representation highlighting the mechanisms underlying mechanisms Linking Obesity, Insulin Resistance, and Alzheimer's Disease and their potential therapeutic implications.
Mechanisms Linking Obesity, Insulin Resistance, and Alzheimer's Disease: Effects of Polyphenols and …
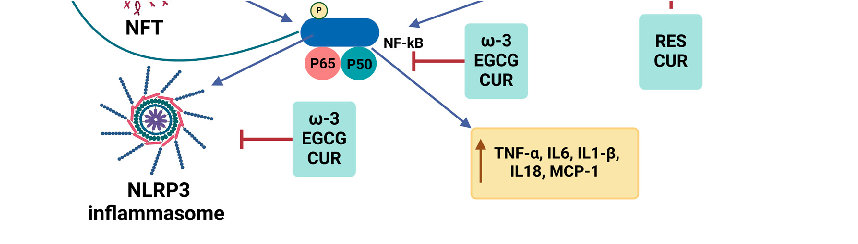
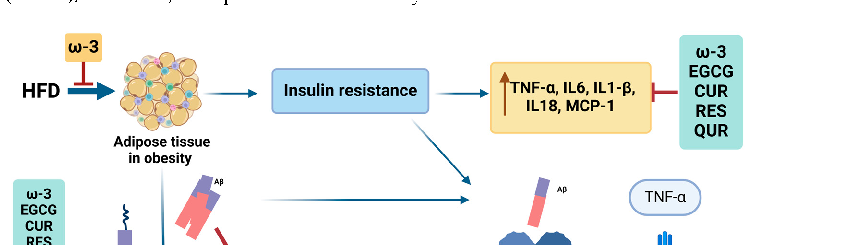
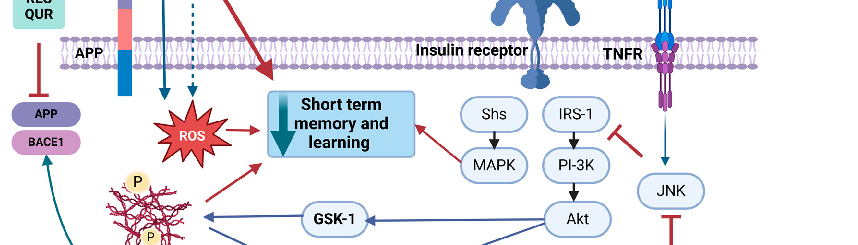
Summary of the mechanistic effects of dietary ω-3 fatty acids and polyphenols on the amyloidogenic pathway. In the context of obesity, IR, and the presence of Aβ, inflammatory pathways are upregulated.
Mechanisms Linking Obesity, Insulin Resistance, and Alzheimer's Disease: Effects of Polyphenols and …
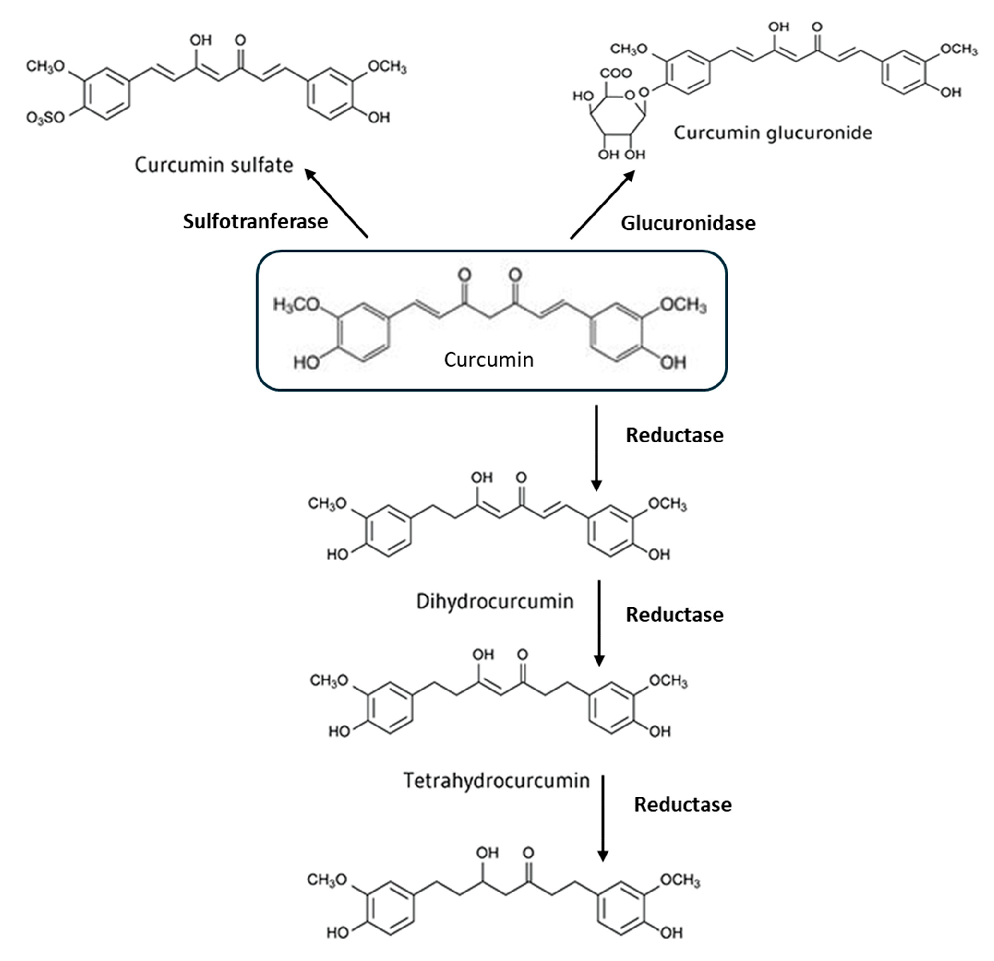
Conceptual diagram summarizing the relationship between curcumin Modulation of the Gut and the biological processes described in this research.
Curcumin Modulation of the Gut-Brain Axis for Neuroinflammation and Metabolic Disorders Prevention …

Visual summary of the pathways and interactions relevant to curcumin Modulation of the Gut, as discussed in the context of curcumin, a polyphenolic compound derived from Curcuma longa, has gained significant attention for its potential ther.
Curcumin Modulation of the Gut-Brain Axis for Neuroinflammation and Metabolic Disorders Prevention …
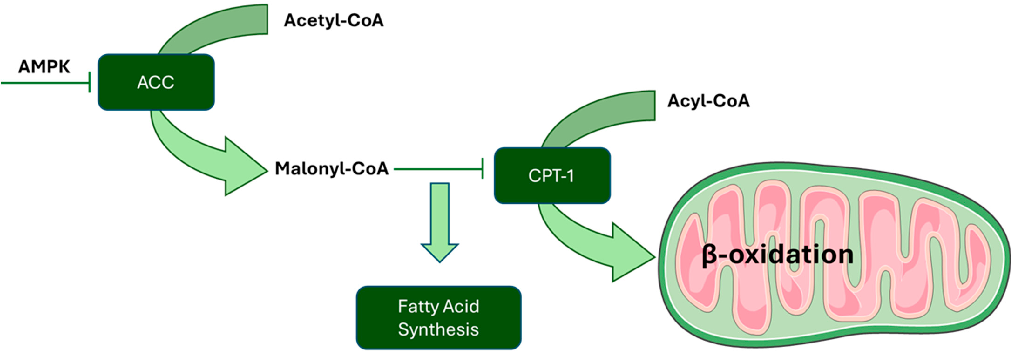
Schematic representation highlighting the mechanisms underlying curcumin Modulation of the Gut and their potential therapeutic implications.
Curcumin Modulation of the Gut-Brain Axis for Neuroinflammation and Metabolic Disorders Prevention …
पृष्ठ 8 / 14